40 Most Dangerous Sports in the World
Forty sports. One transparent evidence system. See what makes each sport dangerous, how strong the underlying data is, and where the risks actually come from.
What the evidence supports
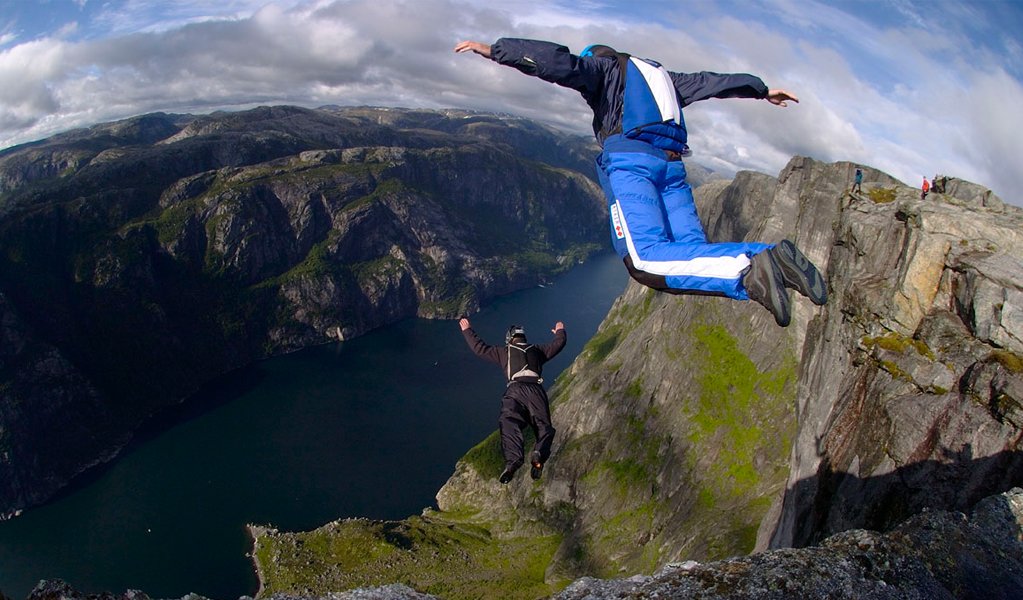
BASE Jumping
BASE jumping shows the clearest high-fatality signal in the evidence reviewed here, but no single metric can universally rank every sport.
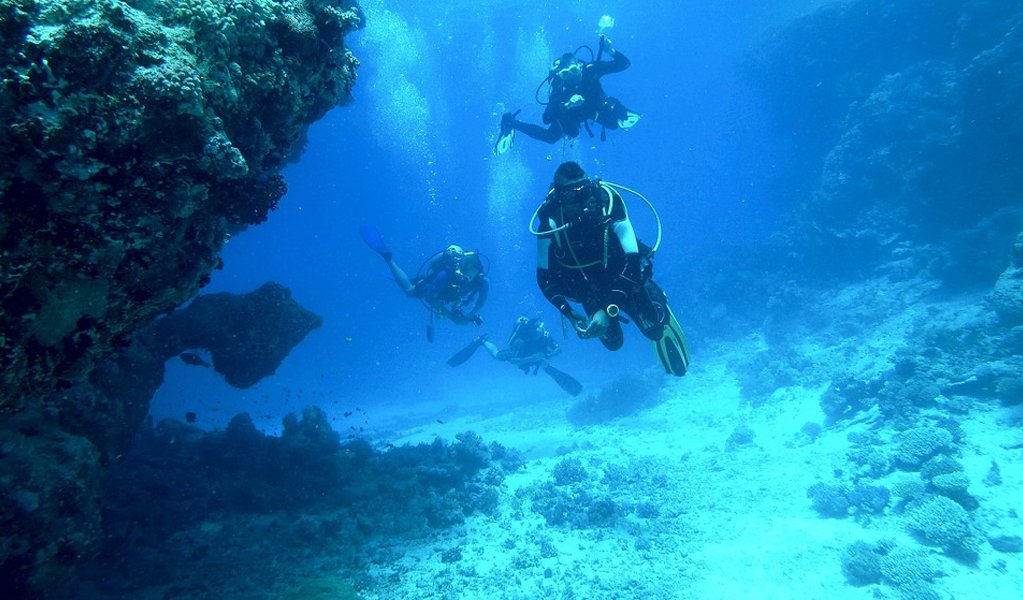
Cave Diving
Clear failure-chain evidence without forcing incompatible rates together.
Reader Voting
Live reader signal, kept separate from verified evidence.

BASE Jumping
Direct jump-denominator evidence gives the clearest fatality signal here.
How the strongest risk signals differ
Each card shows the evidence signal separately from the type and consequence of risk.
BASE Jumping
Cliffs, speed and almost no margin for error.
High-Altitude Climbing
Altitude, weather and rescue exposure compound risk.
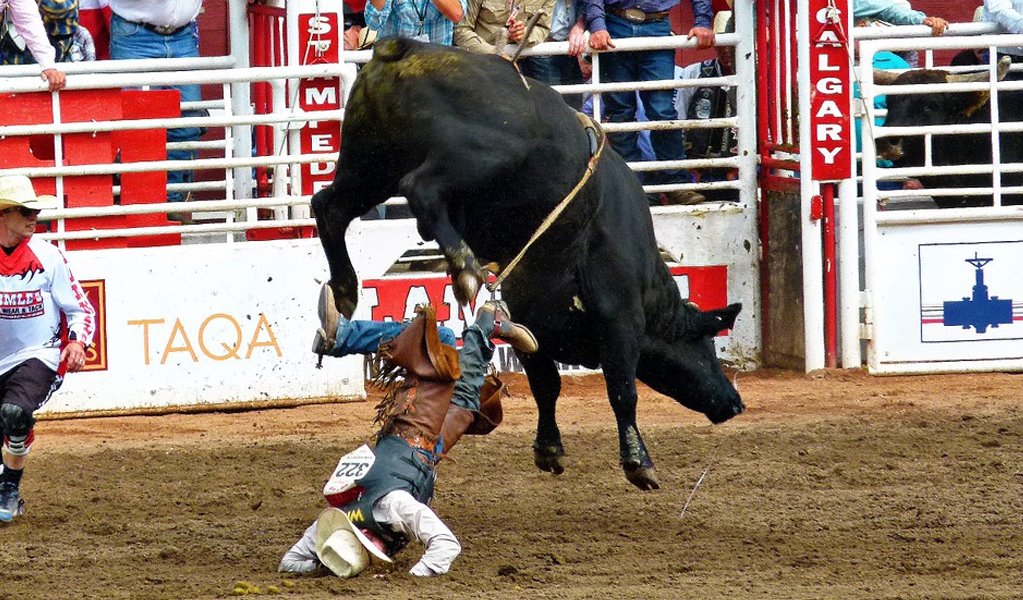
Bull Riding
Unpredictable animal movement and high-energy trauma.
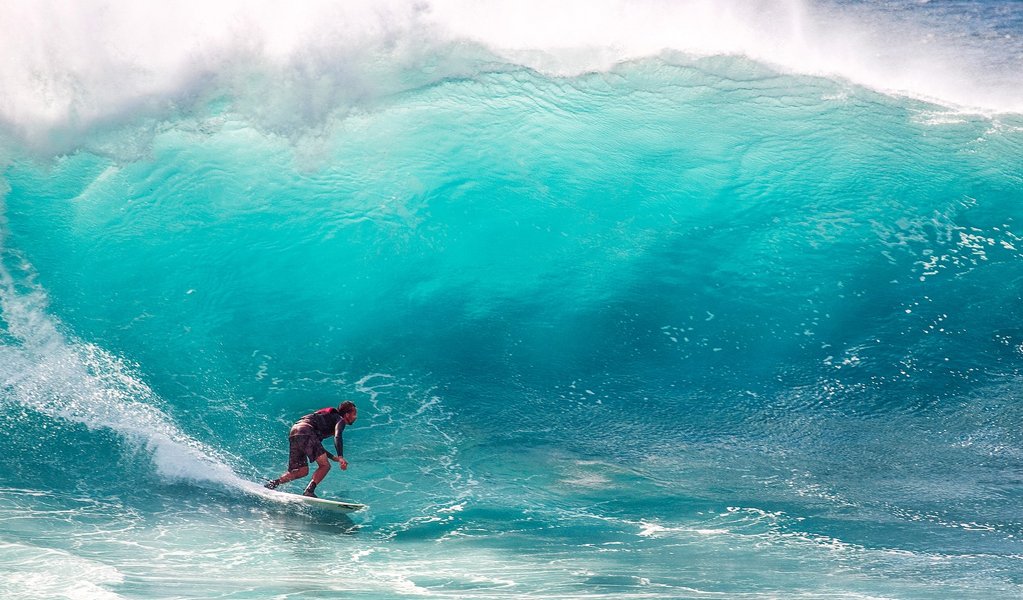
Big-Wave Surfing
Large waves, submersion and hard-bottom impact.
Cave Diving
Overhead environment, navigation and gas failure.
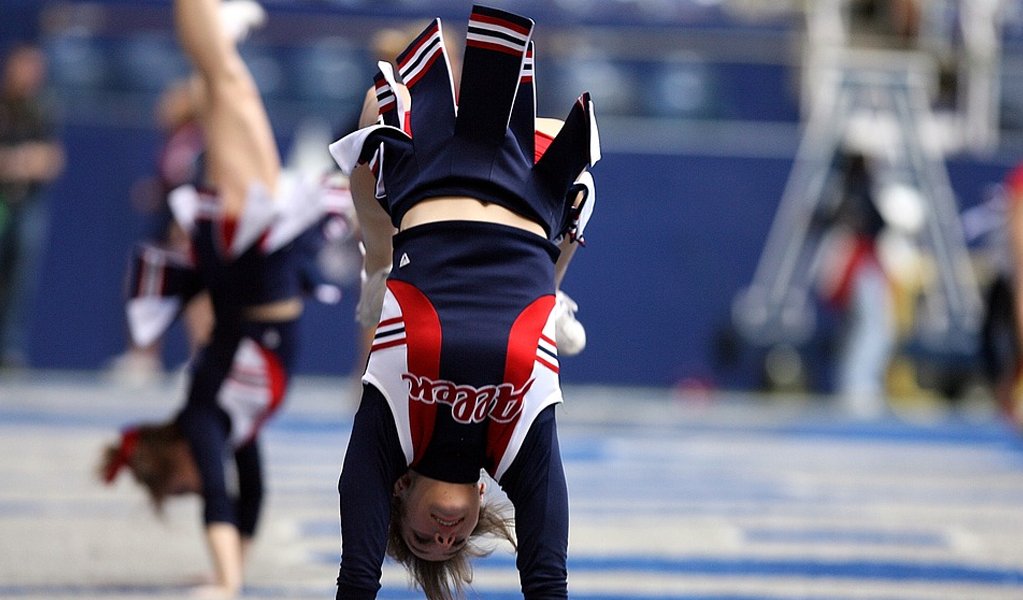
Cheerleading
Aerial stunts combine falls with head and neck exposure.
Pathfinder
Choose the risk question before choosing the sport
- If you mean fatality risk: prioritise denominator-based death data, not total injury counts.
- If you mean serious-injury risk: compare hospitalisation, fracture, traumatic brain/spinal injury and surgery burden.
- If you mean frequent injury: use injuries per exposure or hour where possible.
- If you mean consequence of one mistake: look at environment, rescue access and margin for error.
- If you mean public-health burden: participation volume and emergency-department counts become relevant—but still do not equal individual risk.
Evidence Profiles for 40 Dangerous Sports
Compact cards first. Open a card only when you want its evidence details and source links.
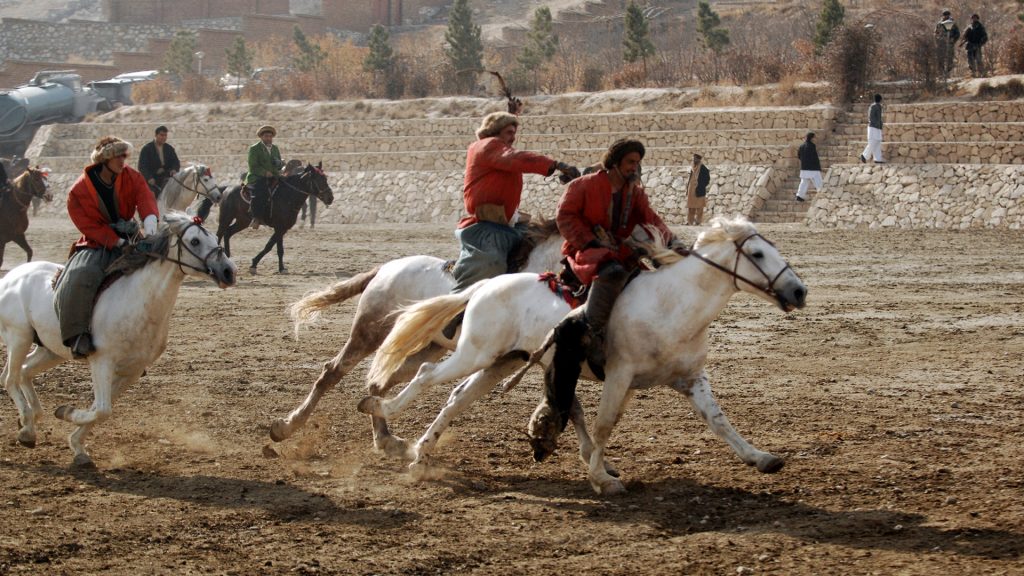 ▶
▶ Buzkashi
Buzkashi combines close-contact competition with horses, falls, collisions and crowd proximity, so its injury mechanisms are credible even where reliable incidence data are not…
Limited · sport-specific injury surveillance is sparse.
View full evidence
Buzkashi combines close-contact competition with horses, falls, collisions and crowd proximity, so its injury mechanisms are credible even where reliable incidence data are not available. The strongest medical evidence we found is broader equestrian trauma research rather than Buzkashi-specific surveillance. In a multicentre trauma-registry study of major equestrian injuries, falls from horses were associated with head injuries and spinal fractures, while kicks and crush mechanisms produced other serious trauma patterns. That evidence helps explain the mechanisms of danger, but it cannot be used to calculate a Buzkashi injury or fatality rate.
- Primary risk mechanisms: falls, horse collision/crush, kicks and rider-to-rider contact.
- What the evidence supports: equestrian mechanisms can cause major head, spine, chest, pelvic and extremity trauma.
- What WU does not claim: the previous “3–5 deaths annually” figure could not be verified from a reliable Buzkashi-specific surveillance source.
- Evidence source: international prospective trauma-registry analysis of major equestrian injuries.
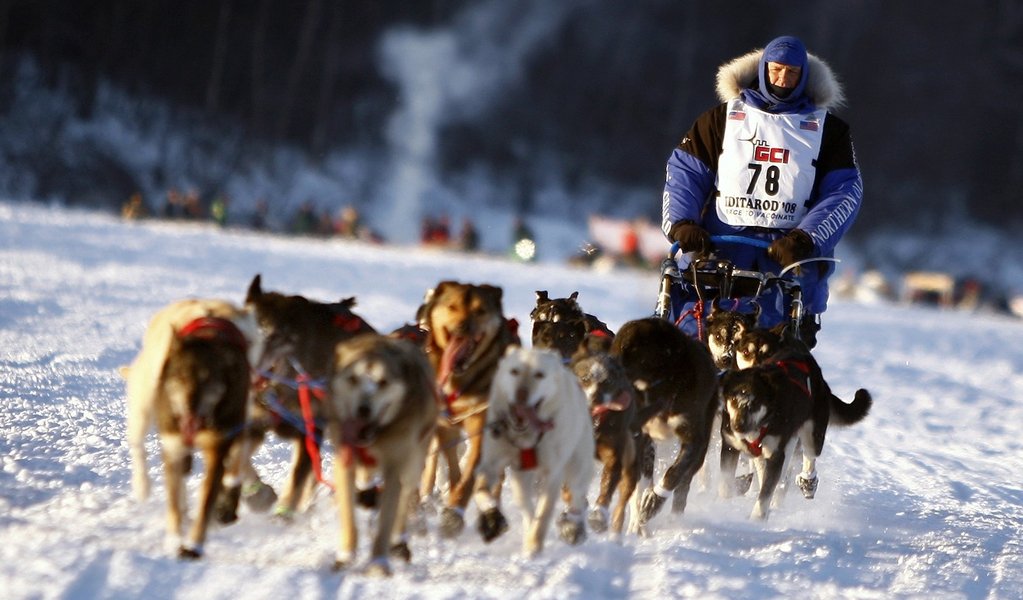 ▶
▶ Iditarod
The Iditarod exposes mushers to prolonged cold, fatigue, remote terrain and limited immediate medical access. A study of competitors in the 2010 race surveyed 62 mushers at the…
Moderate · event-specific human injury data exist, but they do not establish a universal fatality rate.
View full evidence
The Iditarod exposes mushers to prolonged cold, fatigue, remote terrain and limited immediate medical access. A study of competitors in the 2010 race surveyed 62 mushers at the halfway point and 55 at the finish. Forty-two respondents (68%) reported 99 injuries. Frostbite was the most common injury, affecting 20 respondents (31%); two mushers sustained closed head injuries and one required evacuation. Importantly, the researchers concluded that most injuries and illnesses were minor and self-treatable and that life-threatening conditions were rare.
- Best-supported injury signal: frostbite and musculoskeletal pain.
- Serious events documented in the study: two closed head injuries, including one evacuation.
- Interpretation limit: one race-year survey cannot establish a long-term fatality rate or justify the previous “50% completion” claim.
- Evidence source: Injury and illness sustained by human competitors in the 2010 Iditarod sled dog race.
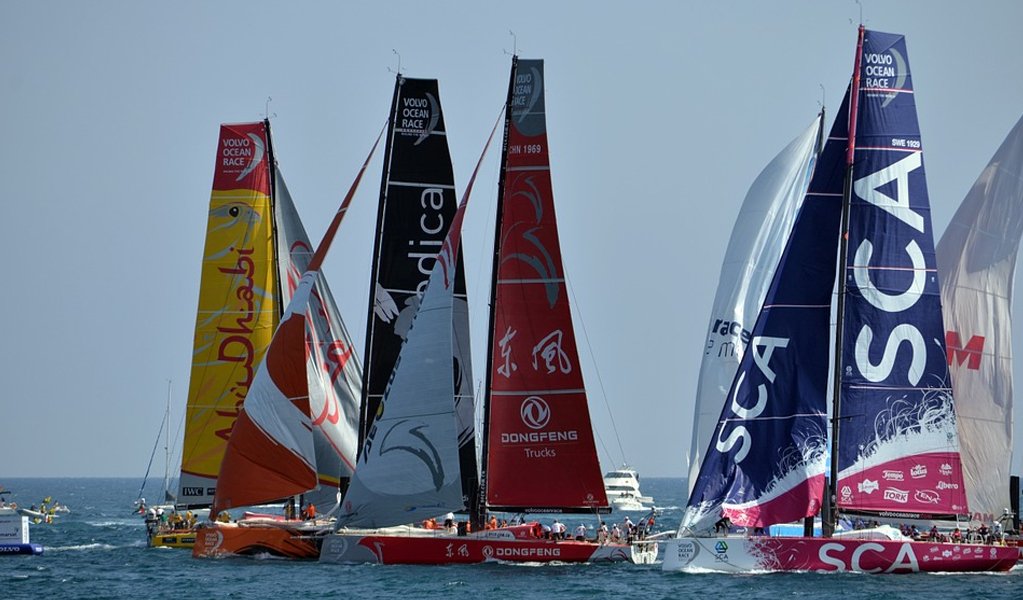 ▶
▶ The Ocean Race (formerly Volvo Ocean Race)
The round-the-world sailing event now known as The Ocean Race combines long offshore legs, severe weather, fatigue, heavy equipment and man-overboard risk. The race’s official…
Moderate · official historical fatality data are available, but exposure-adjusted injury rates are not.
View full evidence
The round-the-world sailing event now known as The Ocean Race combines long offshore legs, severe weather, fatigue, heavy equipment and man-overboard risk. The race’s official historical archive records five sailors who lost their lives at sea across its first 12 editions, during which 2,030 sailors took part. That is meaningful event-specific evidence of fatal risk, but it is a historical count—not a per-participant or per-hour fatality rate—and race technology, safety systems and routes have changed over time.
- Official historical record: five sailor deaths at sea across the first 12 editions.
- Exposure context reported by the organiser: 2,030 sailors had taken part across those editions.
- What WU removes: the previous “about one death per cycle” statement is not supported by the organiser’s historical record.
- Evidence source: The Ocean Race historical facts archive.
 ▶
▶ Jousting
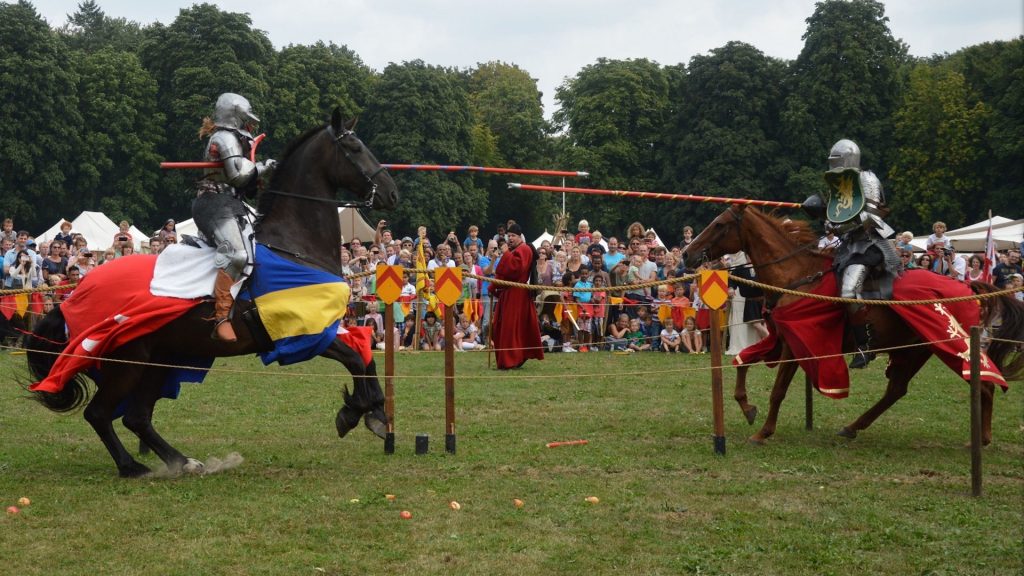
Jousting is a useful example of why historical severity and modern incidence should not be mixed. Lance impact, falls from horses and trampling can plausibly produce severe head,…
Limited · strong historical case evidence, weak modern incidence data.
View full evidence
Jousting is a useful example of why historical severity and modern incidence should not be mixed. Lance impact, falls from horses and trampling can plausibly produce severe head, spine and chest trauma, and historical records document catastrophic outcomes. King Henry II of France died in 1559 after a jousting lance injury; medical analysis of the historical case describes orbital trauma and a fatal intracranial injury. Henry VIII also suffered a serious jousting fall in 1536. These cases show severity potential, but they do not tell us the injury rate in modern organised jousting.
- Severity evidence: historically documented severe and fatal trauma exists.
- Modern evidence gap: WU did not find robust surveillance data establishing a current annual injury or fatality rate for modern jousting.
- What WU removes: the previous estimate of “~5,000 annual participants” was not supported by a reliable source in the audit.
- Evidence source: medical historical analysis of Henry II’s fatal 1559 jousting injury.
 ▶
▶ Street Luging
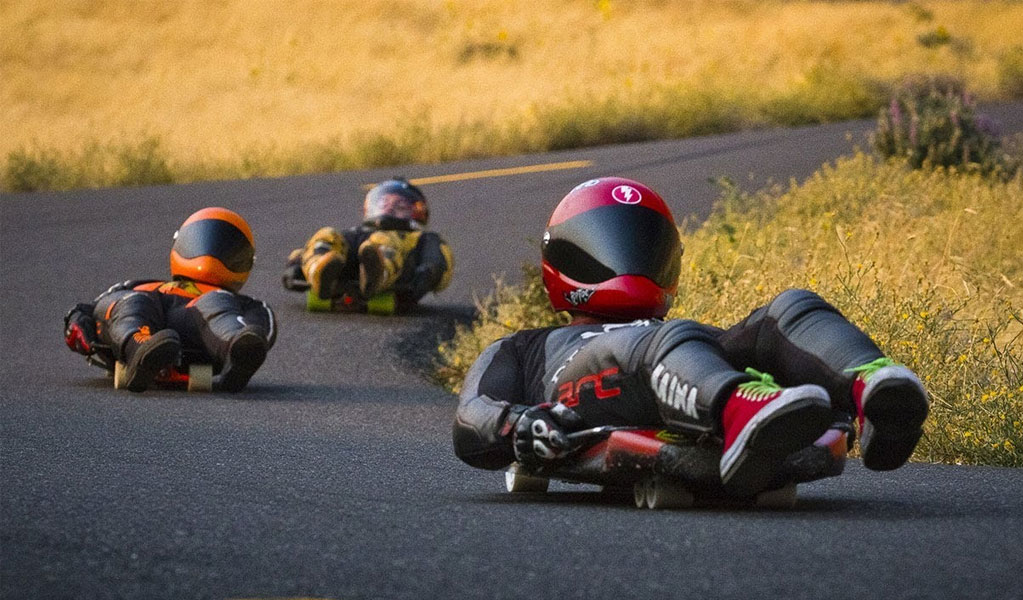
Street luge places the rider close to the road surface at very high downhill speeds with little physical separation from traffic, barriers or pavement. Guinness World Records…
Limited · extreme speed is documented, but street-luge-specific injury epidemiology is scarce.
View full evidence
Street luge places the rider close to the road surface at very high downhill speeds with little physical separation from traffic, barriers or pavement. Guinness World Records documents a gravity-powered street-luge speed of 163.88 km/h (101.83 mph), achieved by Damian Andrey in 2017. That confirms the speed potential, but speed alone is not an injury rate. Medical literature is much stronger for conventional luge and skateboarding than for street luge itself, so WU does not transfer those rates directly to this activity.
- Documented hazard: speeds above 100 mph have been officially recorded in gravity-powered street luge.
- Likely trauma mechanisms: high-energy crash, road impact and vehicle/barrier collision.
- Evidence limitation: conventional track-luge and skateboard injury studies are useful context but are not direct street-luge incidence evidence.
- Evidence source: Guinness World Records — gravity-powered street luge speed.
 ▶
▶ Helicopter Skiing
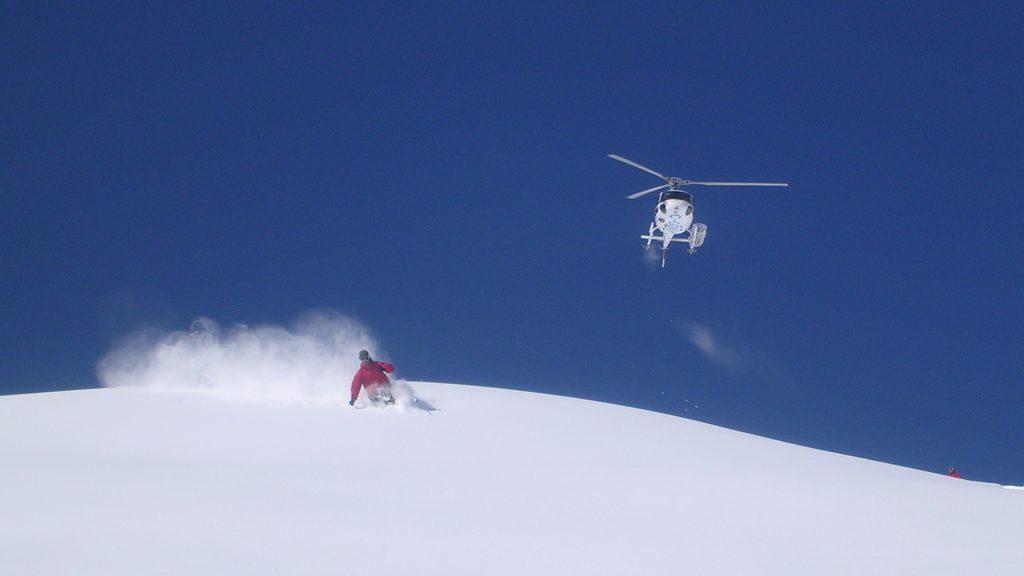
Helicopter skiing combines backcountry terrain with avalanche exposure, tree wells, snow immersion, falls and collisions. A Canadian retrospective analysis covering 3,258,000…
Strong · exposure-adjusted Canadian mechanized-skiing data are available.
View full evidence
Helicopter skiing combines backcountry terrain with avalanche exposure, tree wells, snow immersion, falls and collisions. A Canadian retrospective analysis covering 3,258,000 skier-days from 1970–2016 found that, for 1997–2016, the risk of death from natural winter hazards in mechanized skiing was 18.6 fatalities per million skier-days. Avalanches accounted for 77% of those deaths. The authors also found that major guest injuries were mainly associated with falls and collisions.
- Best-supported fatal hazard: avalanche exposure.
- Other fatal hazards: tree wells and other snow-immersion events.
- Major-injury pattern: falls and collisions.
- Evidence source: Risk of Death and Major Injury from Natural Winter Hazards in Helicopter and Snowcat Skiing in Canada.
▶ BASE Jumping
BASE jumping is one of the clearest high-risk profiles in this guide because several studies provide jump-level denominators. At Norway’s Kjerag massif, 20,850 jumps from 1995–2005…
Strong · multiple sport-specific epidemiology studies document severe injury and fatality risk.
View full evidence
BASE jumping is one of the clearest high-risk profiles in this guide because several studies provide jump-level denominators. At Norway’s Kjerag massif, 20,850 jumps from 1995–2005 produced nine fatalities and 82 non-fatal accidents: about one fatality per 2,317 jumps and one non-fatal accident per 254 jumps in that location and period. A separate international survey reported 39 severe injuries across 19,497 jumps, or about two severe injuries per 1,000 jumps.
- Fatality signal: 9 deaths in 20,850 jumps in the Kjerag study.
- Severe-injury signal: about 2 severe injuries per 1,000 jumps in an international jumper survey.
- Typical serious mechanisms: object strike, hard landing, deployment problems and loss of control.
- Evidence sources: Kjerag 20,850-jump study and severe and catastrophic injury study.
▶ Cave Diving
Cave diving adds overhead-environment risk to scuba diving: direct ascent may be impossible, visibility can collapse, navigation errors can become critical and breathing-gas failure…
Strong for fatal-event patterns · weaker for exposure-adjusted participant risk.
View full evidence
Cave diving adds overhead-environment risk to scuba diving: direct ascent may be impossible, visibility can collapse, navigation errors can become critical and breathing-gas failure can be fatal. A Divers Alert Network review identified 161 U.S. cave-diving deaths from July 1985 to June 2015. The most common terminal pattern was drowning/asphyxia, often preceded by running out of breathing gas after divers became lost in reduced visibility caused by suspended silt.
- Historical U.S. case series: 161 cave-diving fatalities across the 30-year study period.
- Recurring causal chain: loss of visibility/navigation → gas depletion → drowning/asphyxia.
- Important limit: fatality counts do not provide a per-dive risk without a reliable exposure denominator.
- Evidence source: Thirty years of American cave diving fatalities.
 ▶
▶ Lawn Bowls
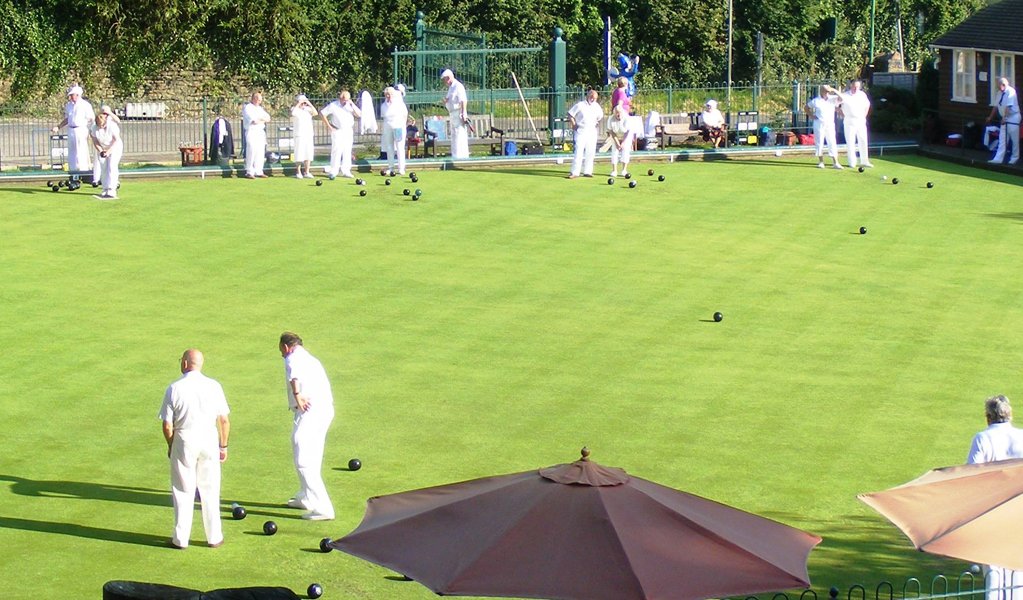
Lawn bowls can cause injury, particularly among older participants, but the evidence profile is fundamentally different from BASE jumping, cave diving or motorsport. A Monash…
Weak inclusion · available evidence does not support classifying lawn bowls alongside high-risk extreme sports.
View full evidence
Lawn bowls can cause injury, particularly among older participants, but the evidence profile is fundamentally different from BASE jumping, cave diving or motorsport. A Monash University injury review described emergency-department presentations as uncommon. In its Victorian surveillance sample, falls were the leading mechanism, followed by overexertion; sprains, strains and fractures were the main injuries. Later Australian research has also identified heat illness as a relevant concern for older players.
- Main documented risks: falls, overexertion, fractures, sprains/strains and heat illness.
- Risk context: many participants are older, which can increase the consequences of falls and heat exposure.
- WU interpretation: this sport remains in the historical 40-profile list, but current evidence does not justify presenting it as one of the world’s intrinsically most dangerous sports.
- Evidence source: Monash University Accident Research Centre lawn-bowls injury review.
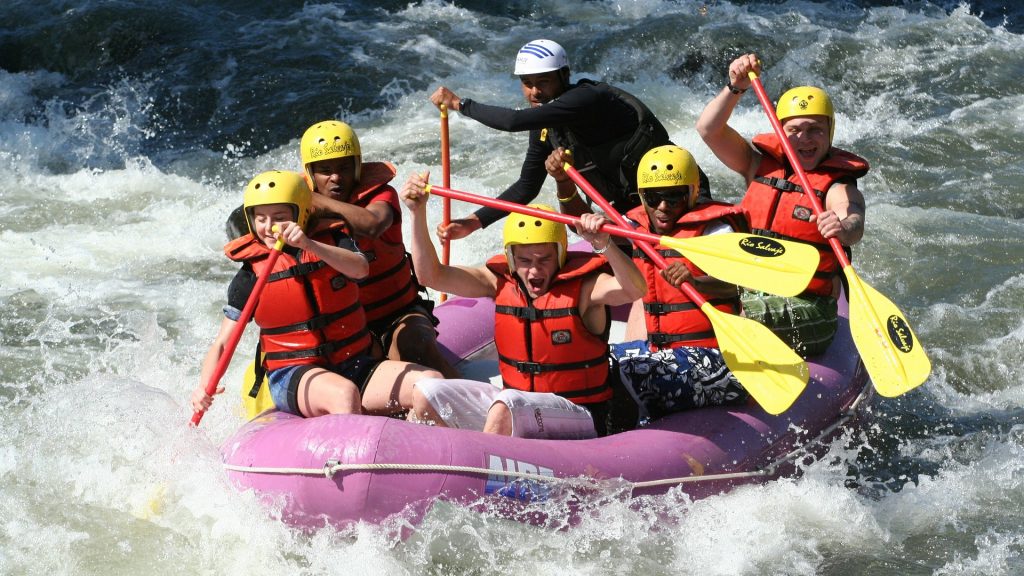 ▶
▶ White Water Rafting
White-water rafting creates risk through capsizing, swimmer impact with rocks or equipment, entrapment and drowning. A sports-medicine review reported rafting injury estimates of…
Moderate to strong · published reviews provide injury and fatality estimates, with important comparability limits.
View full evidence
White-water rafting creates risk through capsizing, swimmer impact with rocks or equipment, entrapment and drowning. A sports-medicine review reported rafting injury estimates of roughly 0.26–2.1 injuries per 100,000 boating days and a fatality estimate of about 0.55 per 100,000 user-days, while warning that methods differed across studies. A New Zealand study of historical rafting deaths found drowning was the dominant fatal mechanism.
- Typical rafting injuries: face and lower-limb trauma, often from equipment or impact while in the water.
- Fatal mechanism: drowning is the main documented concern.
- Evidence limit: published studies use different definitions and denominators, so their rates should not be treated as perfectly interchangeable.
- Evidence sources: white-water injury and fatality review and New Zealand rafting mortality/morbidity study.
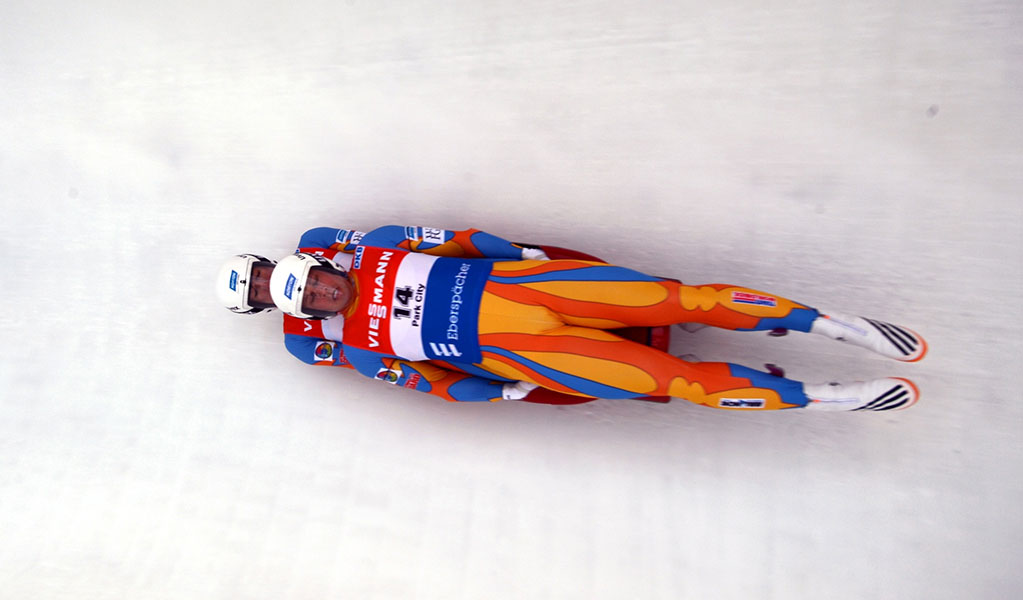 ▶
▶ Luge
Luge looks extreme because athletes travel at high speed with little physical protection, yet the best sport-specific epidemiology is more nuanced. A seven-year study at the U.S.…
Moderate · sport-specific injury data exist, but they do not support calling luge one of the highest-risk sports by injury incidence.
View full evidence
Luge looks extreme because athletes travel at high speed with little physical protection, yet the best sport-specific epidemiology is more nuanced. A seven-year study at the U.S. Training Center in Lake Placid recorded 407 injuries across 57,244 track runs. Contusions and strains were most common; concussions accounted for 2% of injuries and fractures 3%. The authors concluded that luge injury rates were comparable with recreational alpine skiing. Olympic surveillance has also placed luge among the lower-injury winter disciplines in some Games.
- Typical injury pattern: contusions, strains and crash-related trauma.
- Serious injuries in the Lake Placid study: concussions 2%; fractures 3%.
- WU interpretation: visually extreme does not automatically mean the highest measured injury incidence.
- Evidence source: Injuries in the sport of luge: epidemiology and analysis.
▶ High-Altitude Climbing
High-altitude climbing combines fall and avalanche exposure with hypoxia, cold injury, exhaustion and limited rescue options. Everest data now show materially lower mortality in 2007–2024 than in the historical era.
Strong for Everest mortality patterns, with clear era effects · broader high-altitude risk still varies by mountain, route, season and expedition.
View full evidence
High-altitude climbing combines fall and avalanche exposure with hypoxia, cold injury, exhaustion and limited rescue options. The original Everest study reported 1.3% mortality above base camp for 1921–2006. A 2026 update found that overall mortality above base camp fell from 1.4% in 1921–2006 to 0.7% in 2007–2024. For climbers descending from the summit on standard routes, mortality fell from 3.0% to 0.8% between the earlier and modern periods. WU therefore treats Everest risk as strongly era-dependent rather than applying one historical rate to current climbing.
- Historical Everest signal: 1.3% mortality above base camp in the 1921–2006 descriptive study.
- Modern update: 0.7% overall mortality above base camp in 2007–2024 versus 1.4% in 1921–2006 in the updated analysis.
- Summit-descent change: 3.0% mortality in spring 1982–2006 versus 0.8% in 2007–2024 on standard routes.
- Main risk classes: trauma, altitude illness, hypothermia, exhaustion and objective hazards remain important despite improved outcomes.
- Evidence sources: Mortality on Mount Everest, 1921–2006 and Updates to mortality on Mount Everest: 1921–2024.
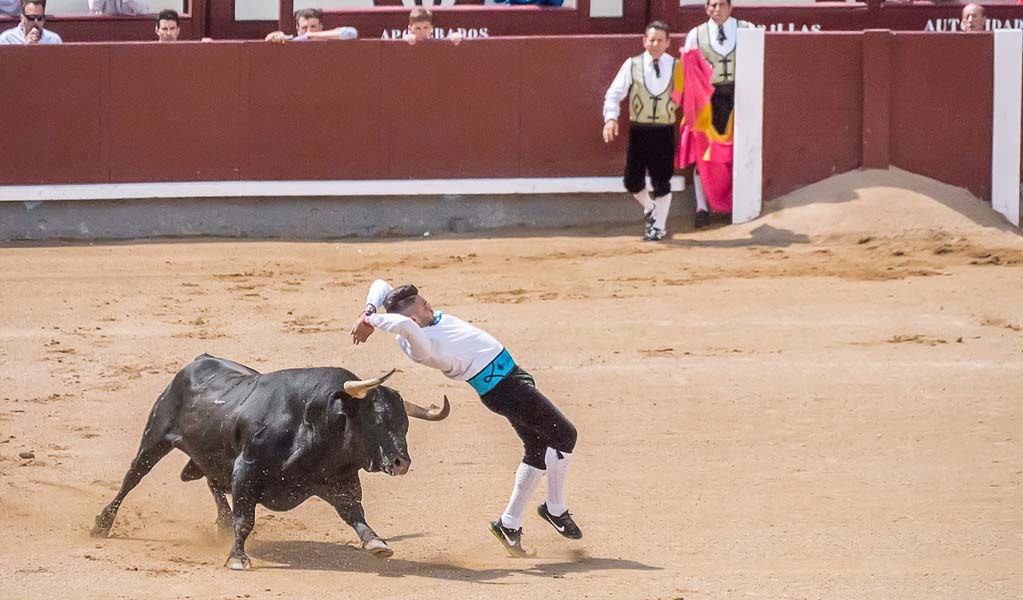 ▶
▶ Bullfighting
Bullfighting injuries are unusual because penetrating horn trauma can damage major vessels and internal structures in seconds. A 10-year trauma-registry study in Guadalajara found…
Strong for injury severity · event formats and participant populations differ.
View full evidence
Bullfighting injuries are unusual because penetrating horn trauma can damage major vessels and internal structures in seconds. A 10-year trauma-registry study in Guadalajara found that 68 of 750 bullfighters (9.06%) required emergency assistance. A later eight-year analysis across Spain, Portugal and southern France included 1,239 patients with fighting-bull horn injuries and reported an accident rate of 9.13% and mortality of 0.48% in that dataset; goring was the dominant mechanism, with thigh and groin injuries especially common.
- Major mechanism: penetrating goring, often involving the thigh/groin and sometimes vascular injury.
- Severity signal: fractures, vascular injury and head trauma increased the odds of severe outcomes.
- Evidence limit: professional bullfighting, amateur festivals and regional traditions should not be treated as one identical exposure population.
- Evidence sources: 10-year bullfight injury series and eight-year European bullfighting injury analysis.
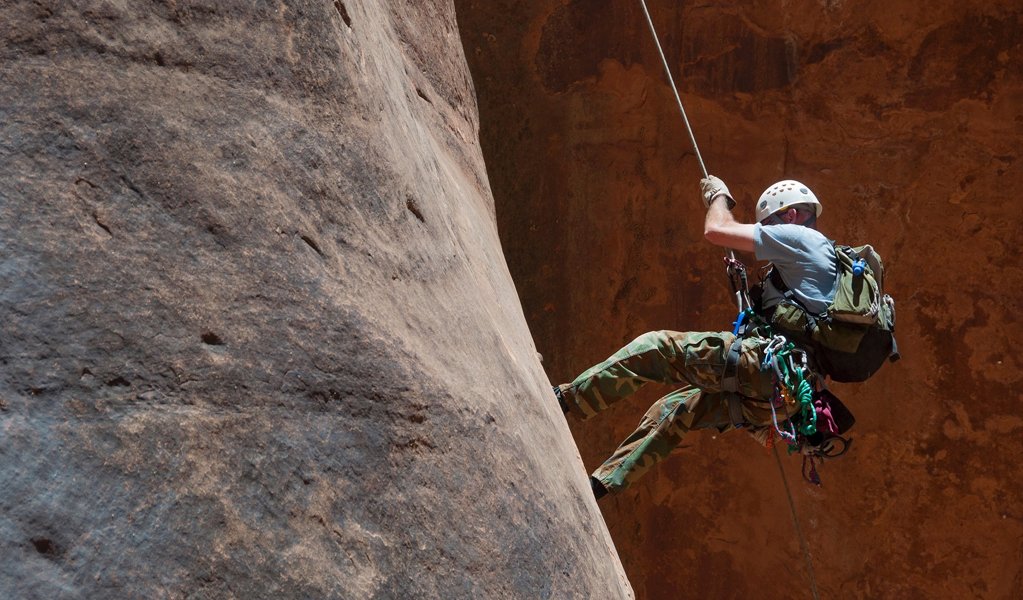 ▶
▶ Rock Climbing
Rock climbing is not one uniform risk category. A 2026 analysis of U.S. emergency-department data estimated 47,251 climbing-related injuries from 2014–2023. Fractures were the most…
Strong for injury patterns · risk varies greatly between indoor climbing, bouldering, sport climbing, traditional climbing and…
View full evidence
Rock climbing is not one uniform risk category. A 2026 analysis of U.S. emergency-department data estimated 47,251 climbing-related injuries from 2014–2023. Fractures were the most common diagnosis (26.8%), followed by sprains/strains (20.4%); lower extremities were injured most often. Earlier epidemiology also shows that injury type and severity depend strongly on climbing discipline and fall mechanism.
- Recent U.S. ED pattern: fractures 26.8%; sprains/strains 20.4%.
- Most affected region: lower extremities in the 2014–2023 ED dataset.
- Key interpretation: gym climbing and exposed outdoor routes should not be assigned the same risk profile.
- Evidence source: National Trends in Rock Climbing Injuries, 2014–2023.
▶ Big-Wave Surfing
Big-wave surfing increases exposure to high-energy wipeouts, prolonged submersion, board impact and hard reef or rock bottoms. Prospective competitive-surfing research found 13 acute…
Moderate for surfing; limited for big-wave-specific incidence.
View full evidence
Big-wave surfing increases exposure to high-energy wipeouts, prolonged submersion, board impact and hard reef or rock bottoms. Prospective competitive-surfing research found 13 acute injuries per 1,000 hours of competition and showed injury risk was 2.4 times higher in overhead-or-larger waves than in smaller waves. Hard rock or reef bottoms also more than doubled injury risk compared with sandy bottoms. Those findings support the direction of risk, but they are not a dedicated big-wave fatality rate.
- Competitive surfing injury rate: 13 acute injuries per 1,000 hours in the prospective contest study.
- Large-wave effect: injury risk was 2.4× higher in overhead-or-larger waves.
- Hard-bottom effect: rock/reef surfing carried 2.6× the injury risk of sandy-bottom surfing in that study.
- Evidence source: prospective study of competitive surfing injuries.
 ▶
▶ Boxing
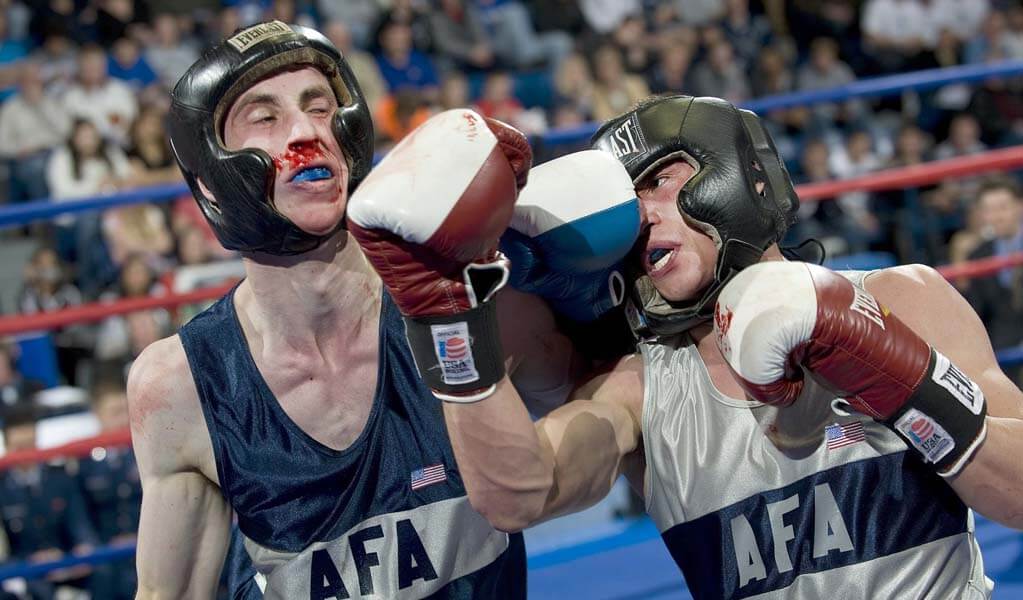
Boxing has a distinctive risk profile because deliberate head and body strikes are part of competition. A 2023 systematic review and meta-analysis of 14 epidemiology studies estimated…
Strong · multiple systematic reviews and meta-analyses quantify boxing injury incidence and head-trauma burden.
View full evidence
Boxing has a distinctive risk profile because deliberate head and body strikes are part of competition. A 2023 systematic review and meta-analysis of 14 epidemiology studies estimated an overall injury incidence of 233.3 injuries per 1,000 competition exposures, with professional boxing substantially higher than amateur boxing. Across the pooled pathology data, soft-tissue contusions were most common, while concussion accounted for 12.3% and fractures for 11.4% of injuries. A separate amateur-boxing meta-analysis found the head and neck were the most commonly injured competition regions.
- Competition injury signal: pooled overall estimate about 233 injuries per 1,000 competition exposures.
- Professional vs amateur: professional boxing showed markedly higher injury incidence in the meta-analysis.
- Head-trauma relevance: concussion and repeated head impact are central to the sport’s evidence profile.
- Evidence sources: 21st-century boxing injury meta-analysis and amateur boxing systematic review and meta-analysis.
▶ Cheerleading
Modern competitive cheerleading combines tumbling, lifts, basket tosses and pyramids. A recent systematic review of collegiate cheerleading found injury rates around 2.4–2.8 per 1,000…
Strong for injury patterns and catastrophic-risk mechanisms · overall rates depend on age, level and stunt exposure.
View full evidence
Modern competitive cheerleading combines tumbling, lifts, basket tosses and pyramids. A recent systematic review of collegiate cheerleading found injury rates around 2.4–2.8 per 1,000 athlete-exposures, with sprains/strains, concussions and fractures among the most common injuries. Stunts and practice sessions were the most frequent injury contexts, while catastrophic injuries disproportionately involved the head and neck. Earlier catastrophic-injury surveillance also identified basket tosses and pyramids as recurring mechanisms.
- Collegiate injury rate: approximately 2.4–2.8 injuries per 1,000 athlete-exposures in the systematic review.
- Common contexts: stunting and practice.
- Catastrophic mechanism signal: head/neck trauma during complex aerial stunts.
- Evidence sources: collegiate cheerleading systematic review and catastrophic cheerleading injury study.
▶ Bull Riding
Bull riding exposes athletes to falls, trampling, horn contact and high-energy impact with an animal many times their body mass. In five years of Canadian professional rodeo…
Strong · professional rodeo research consistently identifies bull riding as one of the highest-injury rodeo events.
View full evidence
Bull riding exposes athletes to falls, trampling, horn contact and high-energy impact with an animal many times their body mass. In five years of Canadian professional rodeo surveillance, bull riding produced 32.2 injuries per 1,000 competitor-exposures and the greatest injury frequency of any event studied. A 2024 systematic review similarly found bull riding contributed the highest share of injuries across rodeo events in the included studies, ranging from 19.4% to 58.4%.
- Canadian professional rodeo incidence: 32.2 injuries per 1,000 competitor-exposures.
- Common severe concerns: head injury/concussion, knee injury, fractures and crush/trampling trauma.
- Cross-study consistency: systematic-review evidence repeatedly places bull riding among the highest-injury rodeo disciplines.
- Evidence sources: five-year Canadian professional rodeo study and 2024 rodeo injury systematic review.
 ▶
▶ Mixed Martial Arts (MMA)
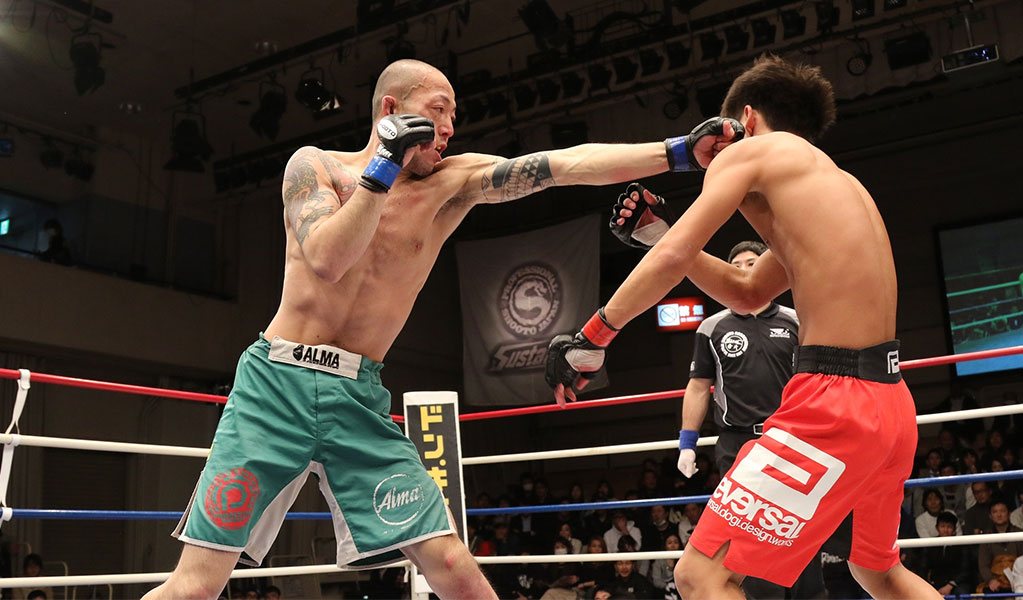
MMA combines striking, takedowns, grappling and submissions, so injury mechanisms span lacerations, concussion, fractures, joint injuries and soft-tissue trauma. A systematic review…
Strong · systematic reviews consistently show high competition injury rates, especially to the head and neck.
View full evidence
MMA combines striking, takedowns, grappling and submissions, so injury mechanisms span lacerations, concussion, fractures, joint injuries and soft-tissue trauma. A systematic review of post-Unified-Rules competition studies reported injury rates ranging from 23.6 to 54.5 injuries per 100 athlete-exposures, with the head and neck accounting for 29.5%–75.9% of injuries. An earlier meta-analysis estimated 228.7 injuries per 1,000 athlete-exposures and found fighters in bouts ending by knockout or technical knockout had more than twice the injury rate of fighters in bouts ending by submission.
- Competition injury range: 23.6–54.5 injuries per 100 athlete-exposures in the post-Unified-Rules review.
- Most affected region: head and neck.
- Outcome effect: KO/TKO bouts are associated with greater injury risk than submission endings.
- Evidence sources: post-Unified-Rules MMA systematic review and MMA injury meta-analysis.
 ▶
▶ Pole Vault
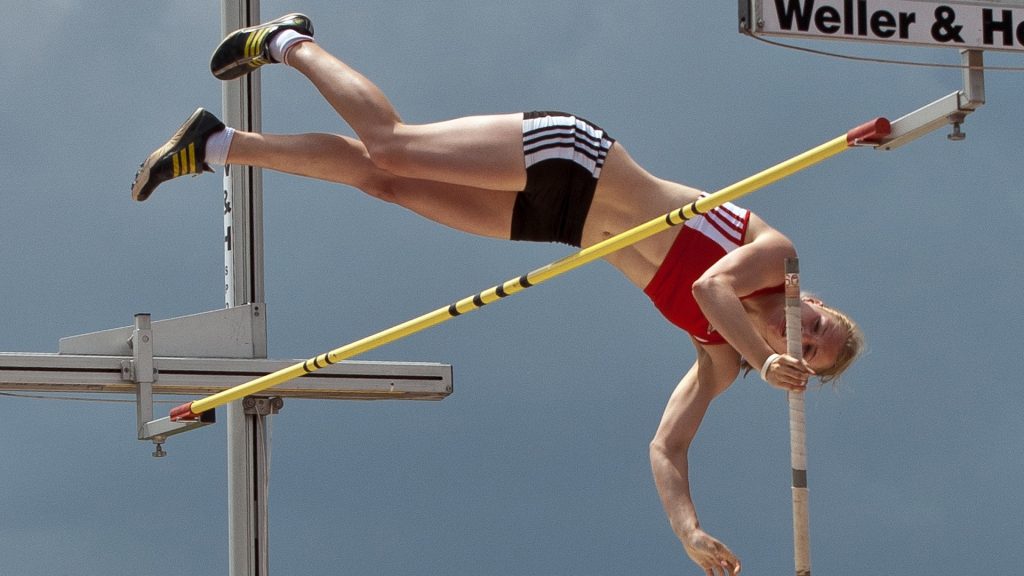
Pole vault illustrates the difference between ordinary injury incidence and rare catastrophic severity. A prospective study of 140 high-school vaulters reported 7.1 injuries per 1,000…
Strong for catastrophic mechanism and youth injury patterns · modern equipment/rule changes materially affect risk.
View full evidence
Pole vault illustrates the difference between ordinary injury incidence and rare catastrophic severity. A prospective study of 140 high-school vaulters reported 7.1 injuries per 1,000 athletic exposures, with lower-extremity trauma accounting for 71.5% of injuries and incorrect landing the most frequent mechanism. Separate catastrophic-injury surveillance from 2003–2011 identified 19 catastrophic U.S. injuries, including major head and spine trauma; larger landing pads reduced fatalities from missing the back or sides of the pit, while landing in or around the vault box remained a major mechanism.
- High-school injury incidence: 7.1 injuries per 1,000 athletic exposures in the prospective study.
- Common injury region: lower extremities.
- Catastrophic mechanism: failed landings, especially around the vault box or outside the safe landing area.
- Evidence sources: prospective high-school pole-vault study and 9-year catastrophic-injury follow-up.
 ▶
▶ Ice Hockey
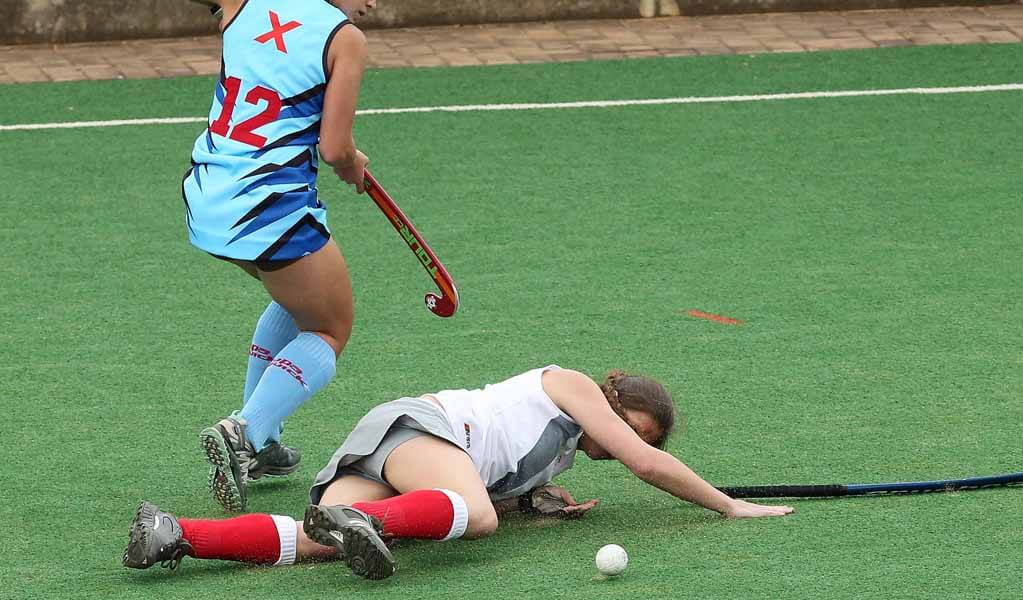
Professional ice hockey combines high-speed skating, collisions, boards, sticks, pucks and repeated change-of-direction loads. A 2024 systematic review found match injury incidence…
Strong · systematic-review data quantify professional match injury incidence and concussion remains an important risk domain.
View full evidence
Professional ice hockey combines high-speed skating, collisions, boards, sticks, pucks and repeated change-of-direction loads. A 2024 systematic review found match injury incidence ranging from 38 to 88.6 injuries per 1,000 hours of exposure, while training incidence was much lower at 0.4–2.6 per 1,000 hours. Most injuries were traumatic, lower-extremity injuries were most common, and severe injuries represented a meaningful minority of cases. Concussion remains a major separate concern across playing levels.
- Match injury incidence: 38–88.6 injuries per 1,000 hours in professional male hockey studies.
- Training incidence: 0.4–2.6 per 1,000 hours.
- Most common region: lower extremities.
- Evidence sources: professional ice hockey systematic review and 2024 concussion review.
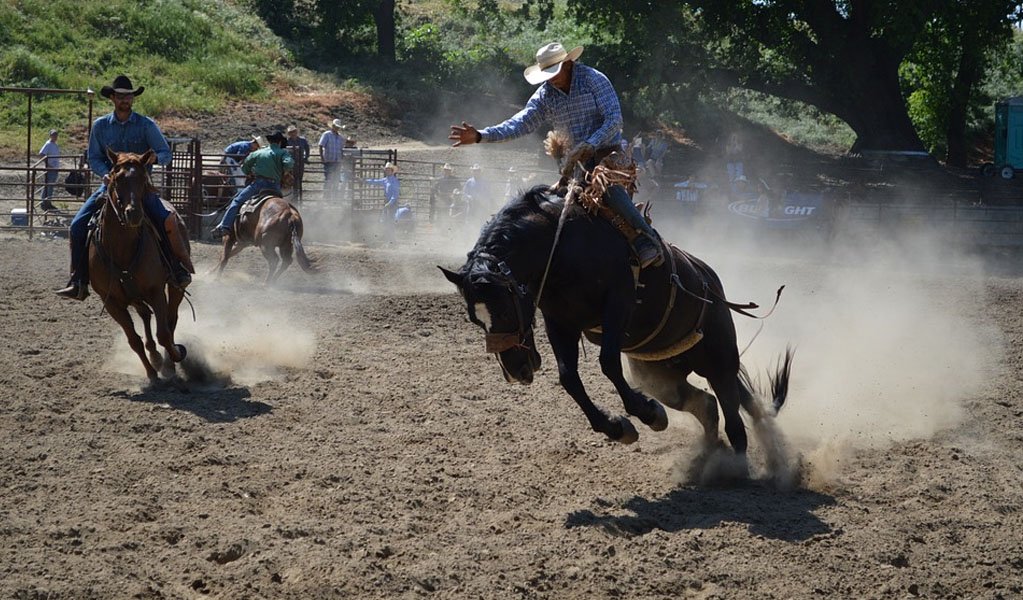 ▶
▶ Horseback Riding
Horse-related trauma ranges from falls to kicks, crush injuries and being dragged or trampled. A 2024 literature review found falls and kicks were the dominant mechanisms, while…
Strong for trauma patterns · incidence varies by discipline, rider experience and exposure.
View full evidence
Horse-related trauma ranges from falls to kicks, crush injuries and being dragged or trampled. A 2024 literature review found falls and kicks were the dominant mechanisms, while common serious injuries included fractures plus head, thoracic and abdominal trauma. Most emergency presentations were discharged, but around one-third of admitted patients required surgery. Mortality was low overall, yet head and neck trauma carried disproportionate severity. Riders exploring the activity can also use our horseback riding guide and horse breeds reference.
- Main mechanisms: falls and kicks.
- Serious injury regions: head/neck, thorax, abdomen and fractures.
- Protective context: helmets reduce skull-fracture and traumatic-brain-injury risk.
- Evidence sources: 2024 horse-trauma review and CNS/thorax equestrian systematic review.
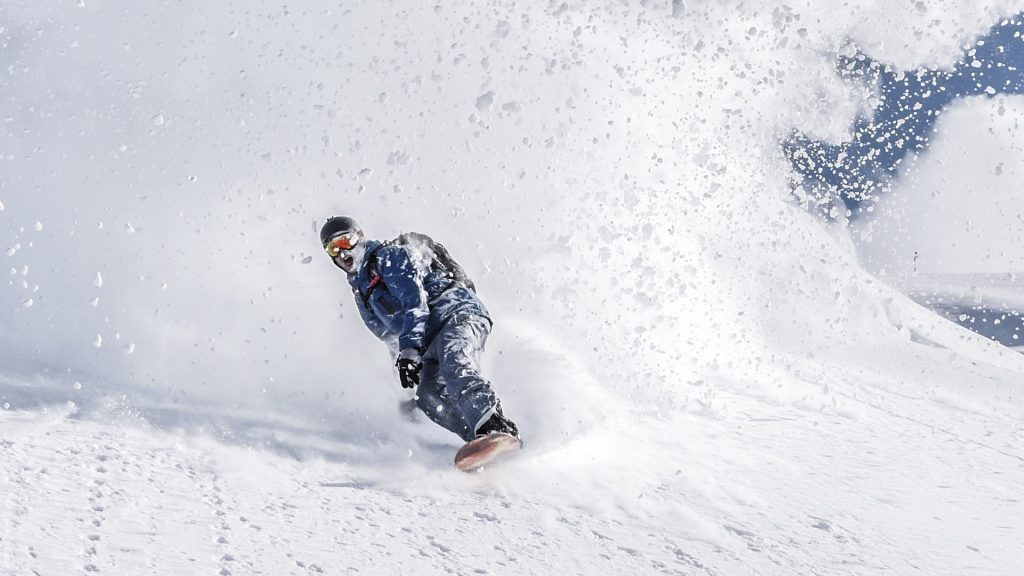 ▶
▶ Snowboarding
Snowboarding injuries cluster around falls, jumps, edge catches and collisions. Older epidemiology reported roughly 4–6 injuries per 1,000 visits, with beginners overrepresented and…
Strong for injury incidence and beginner-risk patterns · discipline and skill level matter.
View full evidence
Snowboarding injuries cluster around falls, jumps, edge catches and collisions. Older epidemiology reported roughly 4–6 injuries per 1,000 visits, with beginners overrepresented and upper-limb fractures more common than in skiing. More recent professional snow-sport meta-analysis estimated 3.49 injuries per 1,000 athlete-days across skiing and snowboarding disciplines. The risk profile changes with freestyle participation, terrain and experience. For comparison with skiing, see our skiing vs snowboarding guide.
- Typical injury regions: wrists/hands, ankles, knees and head.
- Beginner effect: injury risk is highest early in participation.
- Protective signal: wrist protection has been associated with fewer wrist injuries.
- Evidence sources: snowboarding risk study and professional snow-sports meta-analysis.
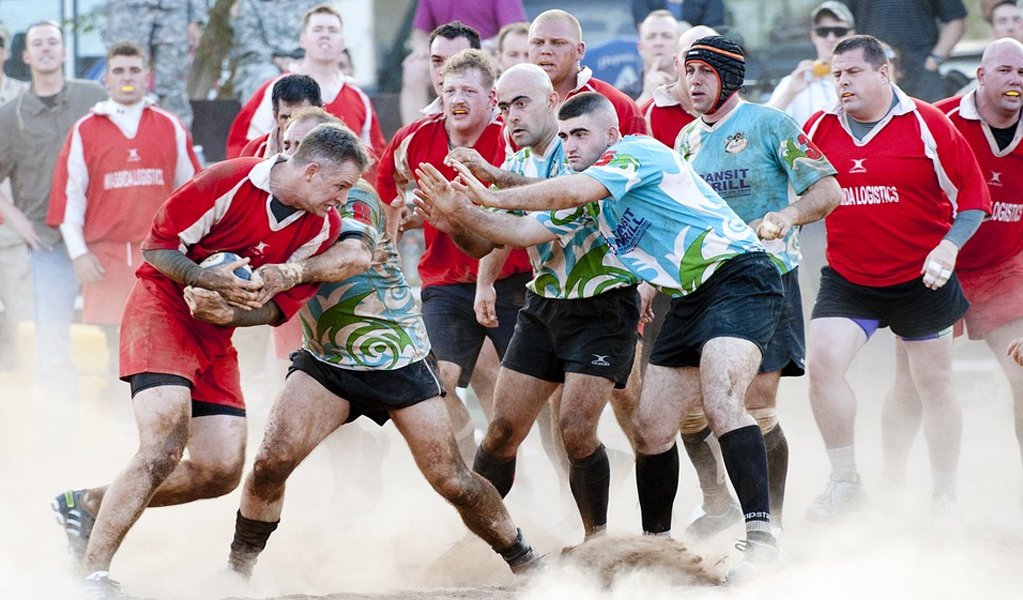 ▶
▶ Rugby
Rugby’s collision-and-tackle environment produces a high match injury burden compared with many field sports. A recent systematic review and meta-analysis synthesised 148 reports…
Strong · large systematic reviews quantify both overall injury incidence and concussion burden.
View full evidence
Rugby’s collision-and-tackle environment produces a high match injury burden compared with many field sports. A recent systematic review and meta-analysis synthesised 148 reports covering more than 8.3 million player-hours and 96,000 injuries. Concussion is a particularly important risk domain: a 2014–2024 meta-analysis estimated pooled concussion incidence around 9–10 per 1,000 player-hours, with match rates dramatically higher than training rates in both rugby union and league.
- Evidence base: more than 8.3 million player-hours in the broad injury meta-analysis.
- Concussion incidence: about 9–10 per 1,000 player-hours overall in recent pooled analyses.
- Exposure effect: match concussion incidence is far higher than training incidence.
- Evidence sources: rugby injury systematic review/meta-analysis and 2014–2024 concussion meta-analysis update.
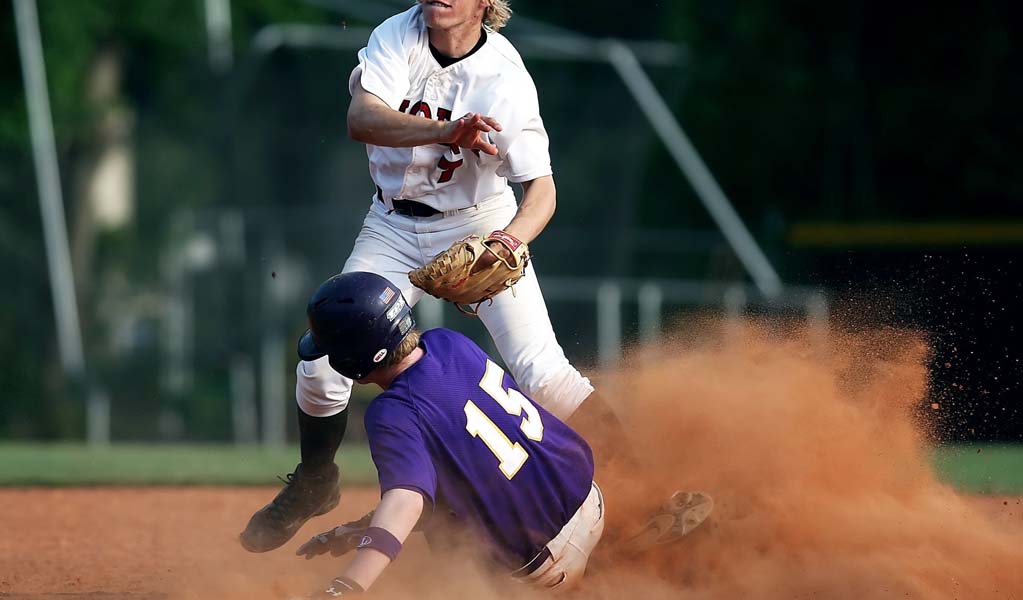 ▶
▶ Baseball
Baseball produces a large volume of musculoskeletal injuries because of throwing, sprinting and repeated competition, but catastrophic events are rare. A recent professional-baseball…
Strong for professional injury burden and rare catastrophic mechanisms · overall participation risk is much lower than the page’s…
View full evidence
Baseball produces a large volume of musculoskeletal injuries because of throwing, sprinting and repeated competition, but catastrophic events are rare. A recent professional-baseball report analysed 83,215 injuries from 2011–2023 across Major and Minor League Baseball, reflecting a substantial workload-related injury burden. Separate catastrophic surveillance from 1982–2002 identified 41 severe incidents in high-school and college baseball, most often involving collisions or athletes struck by batted/thrown balls; 10 were fatal.
- Professional burden: tens of thousands of recorded injuries across MLB/MiLB over 13 seasons.
- Catastrophic mechanisms: batted-ball impact and player collisions.
- WU interpretation: baseball can produce severe rare events, but evidence does not justify treating it as intrinsically comparable with BASE jumping or cave diving.
- Evidence sources: 2011–2023 professional baseball injury report and catastrophic baseball injury study.
 ▶
▶ Gymnastics
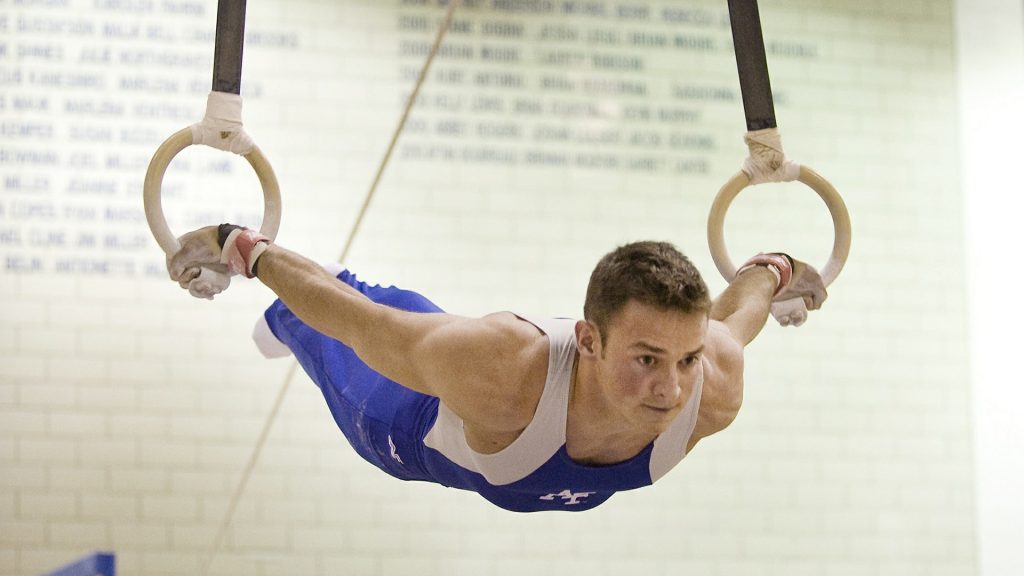
Competitive artistic gymnastics combines repeated impact, inversion, high training volume and complex landings. A systematic review of 22 studies found substantial injury incidence…
Strong · systematic-review evidence shows substantial injury burden, with risk patterns differing by sex, apparatus and competitive…
View full evidence
Competitive artistic gymnastics combines repeated impact, inversion, high training volume and complex landings. A systematic review of 22 studies found substantial injury incidence and prevalence across competitive levels. Female gymnasts sustained more lower-limb injuries, male gymnasts more upper-limb injuries, and floor exercise was associated with the greatest number of injuries in both groups. Higher competitive level and competition exposure were consistent risk factors. For the wider WU sub-silo, see our gymnastics guide.
- Main injury regions: lower limbs in female gymnasts; upper limbs in male gymnasts.
- High-risk context: floor exercise and higher competitive exposure.
- Evidence limit: reported incidence varies materially between studies because definitions and surveillance methods differ.
- Evidence source: systematic review of competitive artistic gymnastics injuries.
 ▶
▶ Cliff Diving
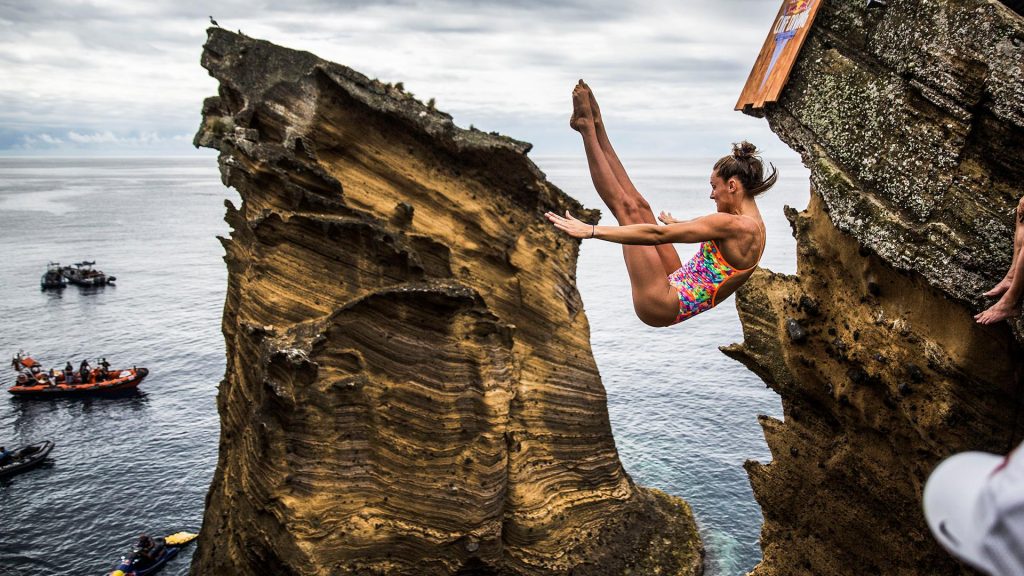
A prospective 2013 study followed 81 cliff divers and 51 splash divers across 7,857 hours of exposure and reported an overall injury rate of 7.9 injuries per 1,000 hours. Cliff divers…
Strong for prospective injury incidence · fatality risk remains less well quantified in organized competition.
View full evidence
A prospective 2013 study followed 81 cliff divers and 51 splash divers across 7,857 hours of exposure and reported an overall injury rate of 7.9 injuries per 1,000 hours. Cliff divers most often injured the foot/ankle and neck/cervical spine. Most injuries occurred during water entry, and practice carried significantly higher injury risk than competition. Most injuries were soft-tissue injuries, although severe injuries were also reported.
- Overall injury incidence: 7.9 injuries per 1,000 hours in the prospective cohort.
- Practice vs competition: 11.3 vs 4.5 injuries per 1,000 hours.
- Main cliff-diving regions: foot/ankle and neck/cervical spine.
- Evidence source: prospective cliff and splash diving injury study.
 ▶
▶ Swimming
Competitive swimming produces a meaningful overuse-injury burden, especially in the shoulder, knee and lower back. A 2021 systematic review found shoulder injuries were the dominant…
Strong for overuse injury prevalence · weak support for classifying pool swimming itself as a high-fatality sport.
View full evidence
Competitive swimming produces a meaningful overuse-injury burden, especially in the shoulder, knee and lower back. A 2021 systematic review found shoulder injuries were the dominant problem and highlighted major methodological differences between studies. A newer 2026 meta-analysis covering 10,973 swimmers likewise found shoulder injuries were the most commonly reported injury category across the literature. That is a very different risk profile from open-water drowning or aquatic recreation, which should not be merged into competitive pool-swimming injury statistics.
- Dominant injury type: shoulder overuse injury.
- Other common regions: knee and lower back/spine.
- WU interpretation: swimming has a substantial musculoskeletal burden, but the evidence does not justify treating routine competitive swimming as comparable to high-fatality extreme sports.
- Evidence sources: 2021 epidemiology review and 2026 systematic review/meta-analysis.
 ▶
▶ Soccer
Professional football/soccer has a well-documented match injury burden, but most injuries are musculoskeletal rather than catastrophic. A systematic review and meta-analysis of…
Strong for injury incidence · catastrophic risk is low relative to many sports in this guide.
View full evidence
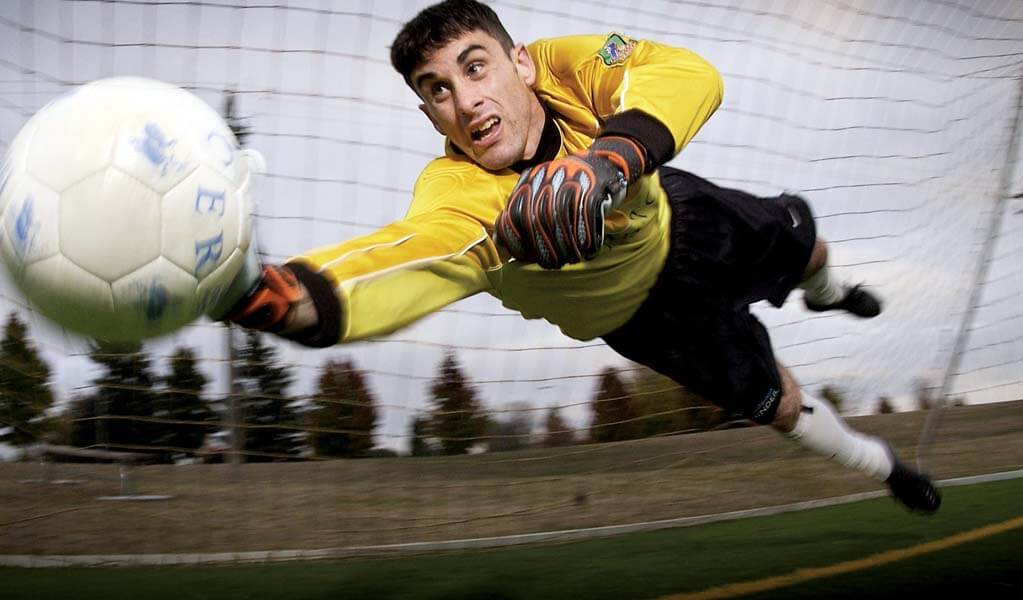
Professional football/soccer has a well-documented match injury burden, but most injuries are musculoskeletal rather than catastrophic. A systematic review and meta-analysis of professional male football estimated overall injury incidence at 8.1 injuries per 1,000 hours, with match incidence around 36 per 1,000 hours—almost ten times the training rate of 3.7. Lower-extremity and muscle/tendon injuries dominated the profile.
- Overall professional incidence: 8.1 injuries per 1,000 hours.
- Match incidence: about 36 per 1,000 hours.
- Training incidence: about 3.7 per 1,000 hours.
- Evidence source: professional football injury systematic review/meta-analysis.
 ▶
▶ Longboarding
Longboarding shifts much of its injury exposure onto roads and streets rather than skate parks. In a Canadian/U.S. emergency-surveillance comparison of injured riders under age 18,…
Moderate · emergency-surveillance data show a distinct injury pattern, but exposure-adjusted population risk remains limited.
View full evidence
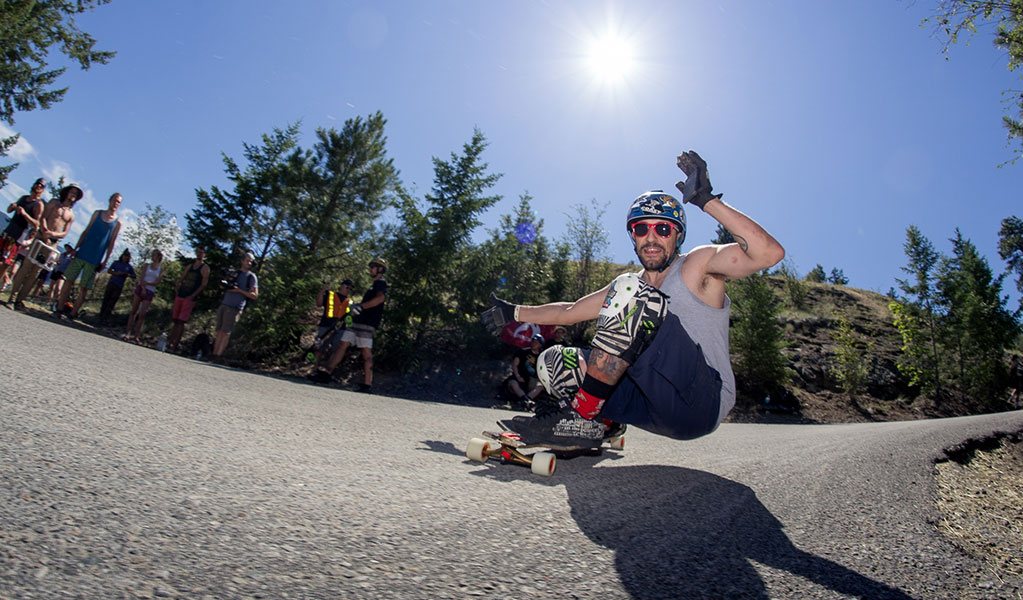
Longboarding shifts much of its injury exposure onto roads and streets rather than skate parks. In a Canadian/U.S. emergency-surveillance comparison of injured riders under age 18, 287 longboarding cases were identified versus 4,198 skateboarding cases. Longboarding injuries occurred mainly on streets and roads and involved the head and neck more often than skateboard injuries. The study also noted five longboarding-related deaths in the United States and Canada in 2012, but those counts do not provide a participant-level fatality rate.
- Road exposure: most longboard injuries in the study occurred on streets/roads.
- Head/neck pattern: longboarders had a higher proportion of head and neck injuries than skateboarders.
- Evidence limit: case counts from emergency surveillance do not tell us the risk per ride, mile or participant.
- Evidence source: longboard vs skateboard injury study.
 ▶
▶ Isle of Man TT
The Isle of Man TT is a public-road motorcycle race on the Mountain Course, where very high speed, walls, buildings, elevation change and limited run-off create unusually severe crash…
Strong for historical danger context · limited for a single comparable participant-risk rate.
View full evidence
The Isle of Man TT is a public-road motorcycle race on the Mountain Course, where very high speed, walls, buildings, elevation change and limited run-off create unusually severe crash consequences. The official TT history documents more than a century of racing on the island and repeated safety changes over time. For WU, the important evidence point is not to turn a cumulative historical death count into a modern per-rider risk without accounting for era, number of starts, course conditions and safety changes.
- Primary hazard: high-speed public-road racing with fixed roadside obstacles.
- Evidence strength: strong historical documentation; weaker exposure-adjusted modern risk comparison.
- SOP rule applied: no unsupported cumulative fatality number is used as if it were a current rate.
- Official context: Isle of Man TT official history timeline.
 ▶
▶ Macau Grand Prix
The Macau Grand Prix is contested on a narrow street circuit where motorcycles and cars race close to barriers with limited run-off. That setting creates a high-consequence crash…
Moderate for hazard profile · limited for exposure-adjusted event-specific injury rates.
View full evidence
The Macau Grand Prix is contested on a narrow street circuit where motorcycles and cars race close to barriers with limited run-off. That setting creates a high-consequence crash environment, particularly for motorcycle competitors. Historical serious and fatal crashes are part of the event record, but WU does not convert those isolated incidents into a comparable “fatality rate” without a reliable denominator covering starts, laps and racing eras.
- Main hazard: high speed on a constrained street circuit with fixed barriers.
- Risk interpretation: severity potential is high even when event-level incidence is not well standardised.
- Evidence limit: no robust modern exposure-adjusted injury dataset was identified in this audit.
- WU status: retained in the historic 40, but marked as evidence-limited rather than falsely quantified.
- Official context: Macau Grand Prix official history documents the Guia Circuit and the event’s long-running street-racing context.
 ▶
▶ Baja 1000
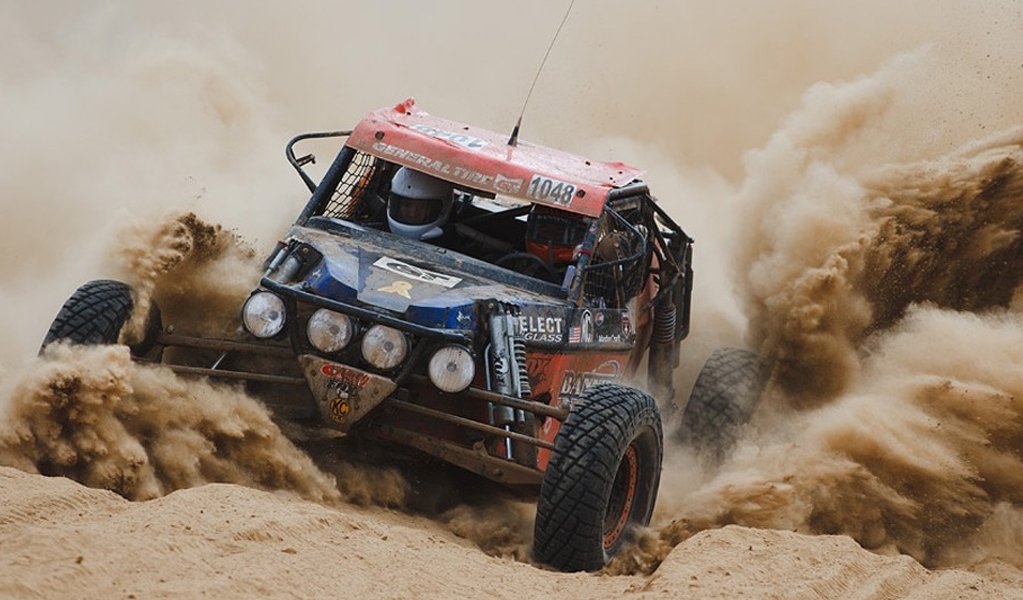
The Baja 1000 adds long-duration fatigue, remote terrain, dust, variable visibility, high speed and mixed off-road hazards. Reliable event-specific injury incidence is sparse, so WU…
Limited event-specific epidemiology · strong mechanistic evidence for off-road motorsport trauma.
View full evidence
The Baja 1000 adds long-duration fatigue, remote terrain, dust, variable visibility, high speed and mixed off-road hazards. Reliable event-specific injury incidence is sparse, so WU does not invent a race-level fatality or injury rate. Broader off-road motorsport literature shows meaningful head, spinal and extremity trauma and supports the underlying injury mechanisms, but those studies are not direct Baja 1000 denominators.
- Main hazards: speed, terrain, fatigue, visibility and delayed access to care.
- Evidence base: off-road motorsport trauma literature rather than Baja-specific incidence surveillance.
- Interpretation limit: motocross/ATV data cannot be numerically transferred to Baja racing.
- Evidence context: review of ATV and motocross injury epidemiology.
 ▶
▶ 24 Hours of Le Mans
Le Mans combines very high speed with night racing, traffic from multiple performance classes, fatigue and long-duration mechanical stress. Its history includes catastrophic incidents…
Moderate overall · strong historical severity context, but limited modern exposure-adjusted participant-risk data.
View full evidence
Le Mans combines very high speed with night racing, traffic from multiple performance classes, fatigue and long-duration mechanical stress. Its history includes catastrophic incidents that reshaped motorsport safety, but modern cars, circuit design, medical response and safety regulation differ profoundly from earlier eras. WU therefore treats historical fatalities as evidence of severity and safety evolution, not as a direct modern annual risk rate.
- Main hazards: speed differential, fatigue, darkness, collision and mechanical failure.
- Historical significance: major accidents materially influenced motorsport safety standards.
- Evidence rule: historical fatalities are not pooled with modern starts as though conditions were unchanged.
- WU status: retained as a high-consequence endurance motorsport profile with explicit era limitations.
- Official context: 24 Hours of Le Mans official history documents the 1955 disaster and the safety changes that followed.
 ▶
▶ NASCAR & Motocross
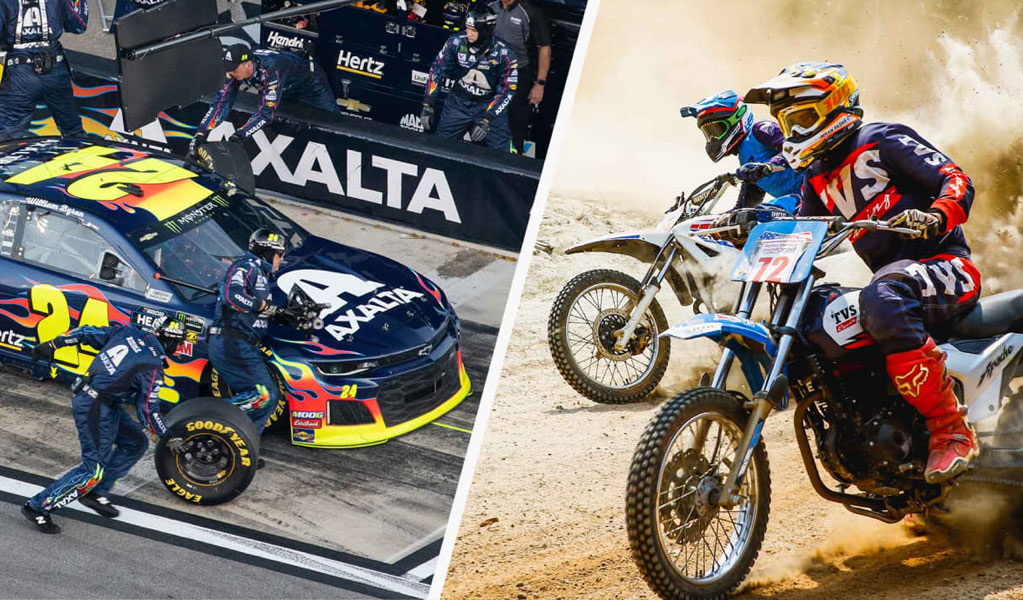
The old article combined NASCAR and motocross under one rank, but their injury mechanisms and evidence bases differ. Motocross research documents substantial extremity, head, chest…
Mixed category · motocross has stronger trauma epidemiology than NASCAR, so the two should not be treated as one statistical sport.
View full evidence
The old article combined NASCAR and motocross under one rank, but their injury mechanisms and evidence bases differ. Motocross research documents substantial extremity, head, chest and spinal trauma; one 12-year competition series recorded 1,870 injuries among 15,870 participating athletes, while a U.S. trauma-database analysis included more than 31,000 injured motocross riders. NASCAR has its own driver and pit-crew injury patterns, but available studies are narrower and should not be numerically merged with motocross.
- Motocross injury pattern: extremity trauma, closed head injury, chest trauma and spinal injury.
- NASCAR evidence: position-specific injuries affect both drivers and pit crews, but the published surveillance base is more limited.
- SOP correction: NASCAR and motocross are kept together only for continuity; their statistics are not combined.
- Evidence sources: 12-year motocross investigation, National Trauma Databank motocross analysis, and NASCAR driver/pit-crew study.
 ▶
▶ American Football
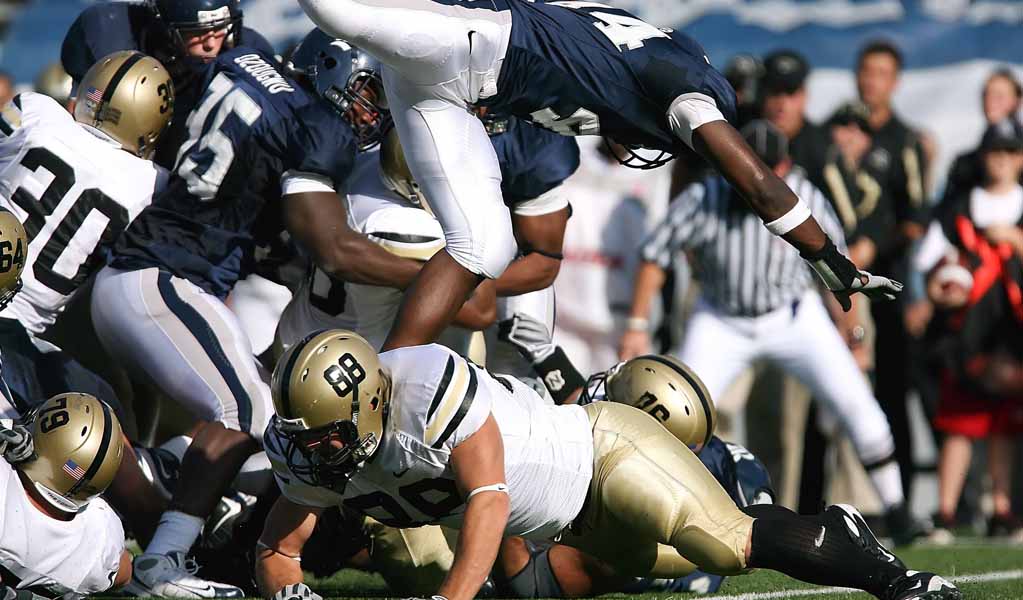
American football combines repeated collision exposure with sprinting, cutting and blocking/tackling mechanisms. Concussion is one of the clearest evidence domains. In a large…
Strong for concussion and contact-injury burden · risk varies sharply by age, level and game versus practice exposure.
View full evidence
American football combines repeated collision exposure with sprinting, cutting and blocking/tackling mechanisms. Concussion is one of the clearest evidence domains. In a large surveillance study spanning youth, high-school and collegiate football, game concussion rates were consistently higher than practice rates; collegiate players recorded 3.74 concussions per 1,000 athlete-exposures in games. Broader reviews also place American football among the sports with relatively high concussion incidence.
- Game vs practice: concussion rates are consistently higher in games.
- College game concussion rate: 3.74 per 1,000 athlete-exposures in the surveillance study.
- Evidence limit: youth, high-school, college and professional football should not be treated as one identical exposure population.
- Evidence sources: youth/high-school/college concussion surveillance and 2024 overview of concussion meta-analyses.
 ▶
▶ Basketball
Basketball’s injury burden is driven mainly by player contact, rapid changes of direction, jumping and landing. A 2025 systematic review and meta-analysis found ankle injuries…
Strong for injury incidence · evidence does not support treating basketball as one of the world’s highest-fatality sports.
View full evidence
Basketball’s injury burden is driven mainly by player contact, rapid changes of direction, jumping and landing. A 2025 systematic review and meta-analysis found ankle injuries accounted for 25.8% and knee injuries 15.5% of reported injuries. Ligament sprains were the most common injury type, followed by muscle/tendon strains and concussion. Female players showed higher incidence for several outcomes including knee injuries and concussion.
- Most common region: ankle, followed by knee.
- Most common injury type: ligament sprain.
- Sex difference: several injury categories, including knee injury and concussion, showed higher incidence in female players.
- Evidence source: 2025 basketball injury systematic review/meta-analysis.
 ▶
▶ Downhill Biking
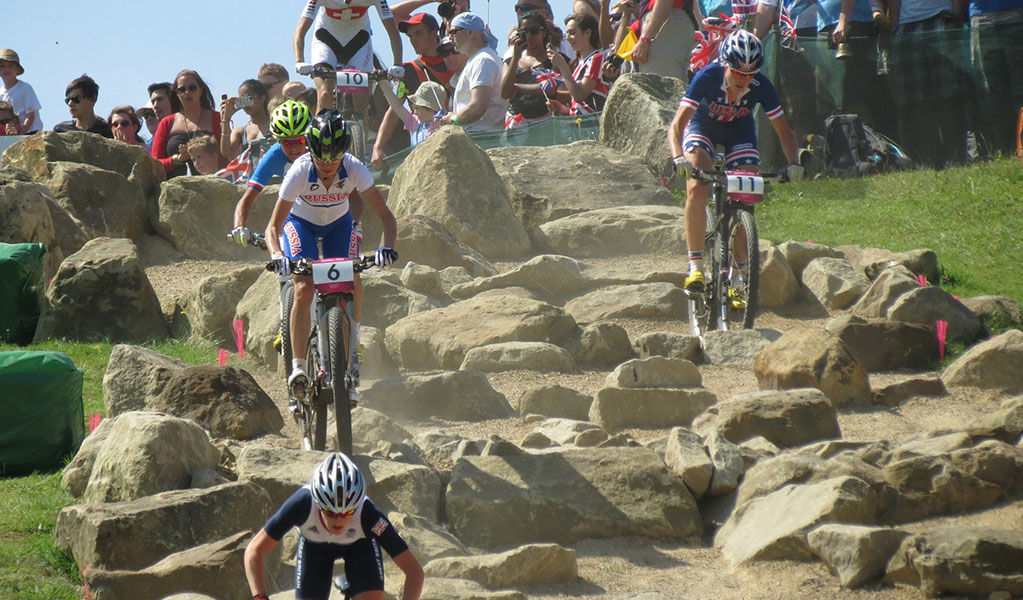
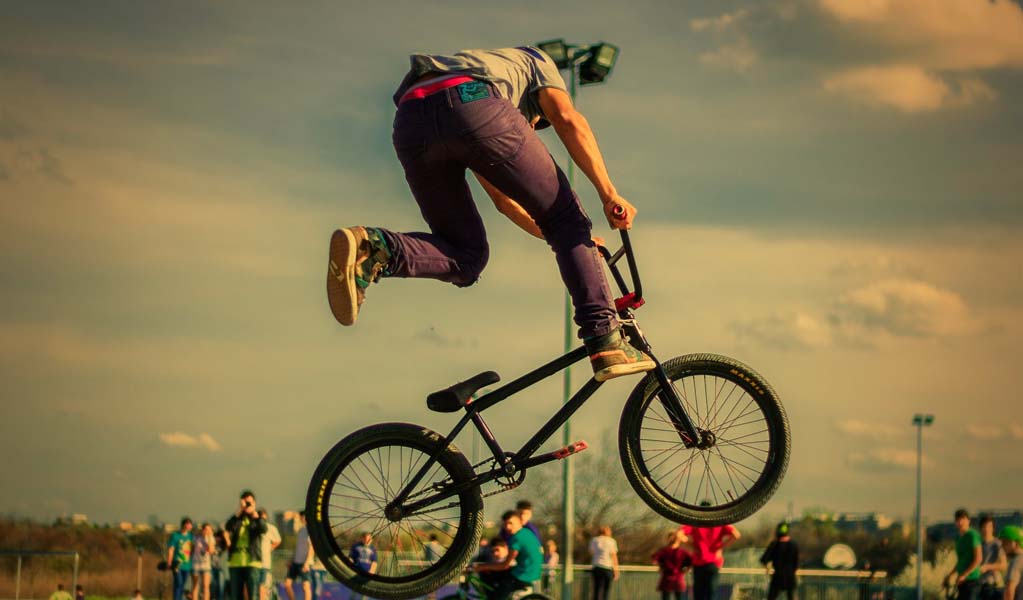
Overlaps with #1 Downhill Mountain BikingThe old article listed “Downhill Biking” and “Downhill Mountain Biking” separately even though the underlying activity is largely the same. WU is preserving both historical positions…
Moderate · this profile substantially overlaps with #1 Downhill Mountain Biking.
View full evidence
The old article listed “Downhill Biking” and “Downhill Mountain Biking” separately even though the underlying activity is largely the same. WU is preserving both historical positions for now, but not pretending they represent two independent evidence categories. Mountain-bike injury reviews show that abrasions, contusions and lacerations are common, while fractures can represent a substantial share of injuries and the upper limbs are frequently affected.
- Common injury types: abrasions, contusions, lacerations and fractures.
- Common body region: upper limbs.
- SOP correction: this profile is flagged as a duplicate/overlap with #1 rather than counted as independent evidence.
- Evidence source: systematic review of mountain-bike injuries.
 ▶
▶ Bicycle Riding
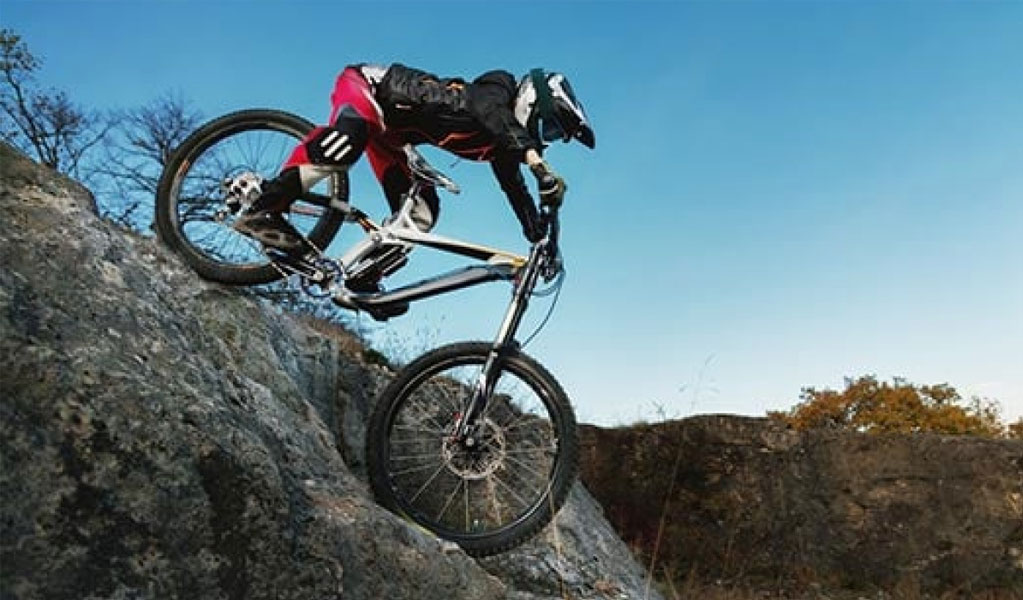
“Bicycle riding” is too broad to behave like one sport in a global danger ranking. In competitive road cycling, a systematic review found abrasions, lacerations and haematomas made up…
Strong for cycling injury patterns · weak as a single “sport” ranking because road, recreational, commuter and competitive cycling…
View full evidence
“Bicycle riding” is too broad to behave like one sport in a global danger ranking. In competitive road cycling, a systematic review found abrasions, lacerations and haematomas made up roughly 40–60% of recorded injuries, fractures around 6–15%, and head injuries including concussion around 5–15%. A newer review across competitive cycling disciplines found important differences between road, mountain-bike, BMX, track and para-cycling injury patterns.
- Road-cycling injury pattern: abrasions/lacerations/haematomas dominate.
- Fractures: roughly 6–15% in the road-cycling review.
- Head injuries: roughly 5–15% in that review.
- Evidence sources: road-cycling systematic review and 2025 competitive-cycling systematic review/meta-analysis.
 ▶
▶ Downhill Mountain Biking
Downhill mountain biking combines high speed, rough terrain, jumps, trees and rock impact. Systematic-review evidence across mountain biking shows most reported injuries are minor,…
Strong for injury pattern · insufficient evidence for a universal claim that it is objectively the world’s single most dangerous sport.
View full evidence
Downhill mountain biking combines high speed, rough terrain, jumps, trees and rock impact. Systematic-review evidence across mountain biking shows most reported injuries are minor, but fractures can account for a substantial proportion and the upper limbs are frequently injured. Competitive cycling research also shows mountain-bike injury profiles differ from road, BMX and track cycling. The evidence supports a high-consequence crash environment, but it does not support the old article’s precise claim that downhill mountain biking is automatically the world’s #1 most dangerous sport across every risk measure.
- Typical injuries: contusions, abrasions, lacerations and fractures.
- Frequent body region: upper extremities.
- Important distinction: high injury severity potential does not equal proof of the highest global fatality rate.
- Evidence sources: mountain-bike injury systematic review and competitive cycling systematic review/meta-analysis.
Risk in numbers
What the strongest datasets actually measure
These numbers use different denominators, populations and study designs. Read each one in its own context—WU does not combine them into a false universal danger score.
The Norwegian Kjerag study covered jumps made from 1995–2005. That is approximately 1 fatality per 2,317 jumps in that location and period.
Published study →An international survey of experienced BASE jumpers reported roughly 2 severe injuries per 1,000 jumps.
Published study →A five-year Canadian professional-rodeo study found bull riding had the greatest injury frequency of the events studied.
Published study →The National Safety Council estimate covers sports and recreational-equipment injuries broadly. Because participation frequency and duration are unknown, it is not an individual-risk ranking.
See the U.S. evidence table ↓Evidence synthesis
What the 40 profiles actually show
The evidence does not support one universal 1–40 scientific ladder. Different sports lead under different definitions of danger, so the strongest signal depends on the question being asked.
No universal ladder
Fatality risk, serious injury, exposure and total injury volume are different measures. One raw number cannot fairly rank every sport.
BASE jumping
It has unusually strong jump-level fatality evidence and a narrow margin for error, making it the clearest high-fatality signal in this guide.
Cave diving & high-altitude climbing
Both show severe consequence profiles shaped by hostile environments, limited rescue margins and well-documented fatal mechanisms.
Mainstream sports
Basketball, soccer and baseball can generate large injury counts partly because participation is far higher; volume is not the same as individual risk.
WU keeps the historical 40-profile structure for search continuity while grading each profile by evidence strength and separating fatality, serious injury, exposure and real-world context.
Repeated mistakes
Five ways “most dangerous sport” lists go wrong
- Using total injuries as individual risk. Popular activities naturally generate more emergency visits.
- Mixing incompatible denominators. Injuries per athlete-exposure, per hour, per jump and raw annual counts are not interchangeable.
- Mixing eras. Historical motorsport deaths cannot be treated as the current risk under modern safety systems.
- Using anecdotes as rates. A famous fatality proves severity can occur; it does not establish incidence.
- Combining different activities. Road cycling, BMX and downhill mountain biking—or NASCAR and motocross—need separate evidence interpretation.
Expert context
Why exposure and severity matter more than dramatic headlines
The International Olympic Committee’s injury-surveillance consensus recommends defining the health problem, recording severity, capturing athlete exposure, describing the study population and expressing risk with consistent methods. WU uses those principles as the methodological baseline for this guide. Where two sports use incompatible exposure units or injury definitions, we do not manufacture a direct numerical comparison.
IOC 2020 consensus statement on sports injury and illness epidemiology
Researchers & incident-analysis voices
What the people studying these risks add
These are not celebrity endorsements and they do not create a separate ranking. WU uses named researchers and accident-analysis specialists to explain what the underlying evidence can—and cannot—tell us.

Kjetil Søreide
Acute-care and trauma researcher
Søreide and colleagues reviewed 20,850 BASE jumps made at Norway’s Kjerag massif between 1995 and 2005, examining deaths, accidents and rescue involvement. That kind of jump-level denominator is why BASE jumping has unusually strong risk evidence compared with many extreme sports.
Read the Kjerag study
Omer Mei-Dan and colleagues
Sports-medicine injury researchers
A survey of experienced international BASE jumpers reported 39 severe injuries across 19,497 jumps, equivalent to about two severe injuries per 1,000 jumps in that study. Lower-limb trauma dominated, while spinal, chest and head injuries also appeared.
Read the severe-injury studyPierre Bouchat & Eric Brymer
Psychological and extreme-sport researchers
Their analysis of BASE-jumping fatalities between 2007 and 2017 focused on the causes of fatal events and on prevention-oriented recommendations. WU uses work like this to separate mechanism and human factors from headline fatality counts.
Read the fatality analysis →Dale Butterwick & Willem Meeuwisse
University of Calgary sports-medicine researchers
Their prospective Canadian professional-rodeo study followed 4,375 bull-riding competitor exposures. Thirty-six percent of recorded bull-riding injuries were classified as severe, with fractures the most common severe injury and head, neck and facial trauma identified as an important prevention concern.
Read the bull-riding study →Frauke Tillmans, PhD · Divers Alert Network
DAN research director
DAN’s 2024 preliminary analysis of a fatal incident in Norway’s Plura cave system concluded that the specific event was most consistent with a medical cause rather than equipment failure. The broader lesson is not that all cave-diving fatalities share one cause, but that medical or physiological problems that may be manageable at the surface can become critical underwater.
Read DAN’s Plura analysis →Named experts strengthen interpretation only when their published work or documented analysis matches the claim being made. Their credentials do not override conflicting data, and a single incident is never treated as a population-wide rate.
Places · real-world context
Where the risk becomes real
These are documented places closely associated with the sports in this guide. This is not a “best places” ranking: location changes terrain, access, rescue options, rules and exposure.
Kjerag · Lysefjord
Visit Norway describes Kjerag as one of the world’s leading BASE-jumping sites. The mountain plateau rises above Lysefjord, with Lysebotn serving as the local access base.
Visit Norway source →Yosemite · El Capitan
Yosemite helped shape modern big-wall climbing. The National Park Service requires a wilderness climbing permit for overnight big-wall climbs.
National Park Service →Peacock Springs · Florida
Florida State Parks allows cavern and cave diving here only for certified dive teams. Dive parties must include at least two divers, and solo diving is prohibited.
Florida State Parks →Praia do Norte · Nazaré
Guinness World Records verified Maya Gabeira’s 22.4 m (73.5 ft) wave here in 2020, underlining Nazaré’s role in modern big-wave surfing.
Guinness record source →People · documented achievement
People who shaped these sports
These are documented pioneers, record-setters and elite competitors—not a subjective “greatest athletes” ranking. Each entry is tied to a specific achievement or recognised contribution.
Maya Gabeira
Guinness World Records verifies Gabeira’s 22.4 m (73.5 ft) wave at Nazaré in 2020 as the largest wave surfed unlimited by a woman, improving on her own earlier record.
Verified record →Hans Florine
Yosemite National Park documented Florine’s 100th ascent of The Nose on El Capitan. He previously held The Nose speed record with Alex Honnold.
National Park Service profile →Jill Heinerth
The Royal Canadian Geographical Society profiles Heinerth as one of the world’s most accomplished cave divers, with more than 7,000 dives and pioneering exploration work in extreme environments.
Explorer profile →Eli Tomac
Pro Motocross records Tomac as a four-time 450MX champion with 32 career 450-class overall victories, placing him among the defining riders of his era.
Pro Motocross profile →Events · rules · governing structures
How these sports are formally organised
Competition bodies and event structures show where rules, records and athlete pathways are maintained. This layer adds governance context; it does not prove that one sport is more dangerous than another.
FAI Skydiving Commission
The FAI Skydiving Commission oversees international parachuting competition and world-record structures. Its 2026 calendar includes world championships in formation skydiving, canopy piloting, wingsuit flying and speed skydiving.
FAI structure →WHOOP UCI Mountain Bike World Series
The UCI’s 2026 World Series runs across 14 rounds in nine countries and includes downhill alongside cross-country and enduro formats.
UCI 2026 calendar →FIM Motocross World Championship
The FIM’s 2026 provisional MXGP calendar features 20 rounds, followed by the Motocross of Nations as the season-ending international team event.
FIM championship calendar →ICF World Championships
The 2026 ICF Canoe Slalom World Championships were staged in Oklahoma City from 20–25 July, with canoe, kayak and kayak-cross competition and Olympic-ranking implications on the road to LA28.
ICF World Championships →Participation reality
Can an ordinary traveller actually do this?
A dramatic location photo does not tell you whether an activity is open to beginners. Access can depend on certification, permits, local rules, specialist equipment and experience.
Certified teams only
Florida State Parks requires cave-diving certification for teams using the cave system. Dive parties must include at least two divers, and solo diving is prohibited.
Overnight climbs need a permit
Yosemite allows climbing, but overnight big-wall climbs require a wilderness climbing permit. The park also publishes climbing regulations and seasonal information that visitors are expected to check before a trip.
Established site, not a beginner activity
Kjerag is internationally associated with BASE jumping, but that does not make the activity comparable to a guided sightseeing experience. The jump environment involves high cliffs, specialised parachute systems and very small margins for error.
Watching and participating are very different
Nazaré is accessible as a destination, but the record-setting waves associated with Praia do Norte belong to elite big-wave surfing. The world-record evidence on this page should not be read as a participation recommendation for ordinary beach visitors.
Failure modes · rescue reality
How serious incidents typically develop
The same label—“dangerous”—can hide very different failure chains. These examples summarise recurring mechanisms already documented in the evidence profiles above.
Little time to recover from one error
Serious incidents commonly involve object strike, hard landing, deployment problems or loss of control. Because jumps begin close to terrain, the recovery window can be extremely short.
A small problem can become an exit problem
In an overhead environment, direct ascent may be impossible. The profile evidence highlights loss of visibility, navigation error and breathing-gas failure as a recurring fatal chain.
Risk compounds with environment and delay
Altitude, weather and limited rescue options can interact rather than act alone. Deterioration may be harder to reverse when evacuation is slow and conditions are worsening.
The athlete and the hazard keep moving
Falls are only part of the problem. Published rodeo research documents severe trauma from impact, trampling and horn contact, with head, knee, fracture and crush injuries among the major concerns.
Risk controls · practical safeguards
What actually changes the margin for error
Risk cannot be removed, but some controls meaningfully change exposure: qualification standards, route and weather decisions, team systems, permits and formal competition rules.
Certification + team discipline
At Peacock Springs, cave-diving access is restricted to certified teams. Dive parties must include at least two divers, which directly addresses the consequences of navigation, visibility and gas-management failures.
Permit + conditions planning
Yosemite requires wilderness climbing permits for overnight big-wall routes. The permit system sits alongside park regulations and condition information, reinforcing planning before committing to a long route.
Standardised rules and progression
FAI competition and record structures standardise disciplines, judging and recognised performance. Formal systems do not remove risk, but they create common rules and clearer progression than informal participation alone.
Formal event rules and course control
FIM-sanctioned competition operates within a defined championship structure. Controlled courses, sporting rules and technical standards provide a more structured risk environment than unsupervised riding.
Evidence gaps · limits
What the data still cannot tell us
A useful evidence guide should show uncertainty as clearly as it shows numbers. Several sports have strong incident evidence but still lack the comparable exposure data needed for a universal ranking.
Different denominators
A death per jump, an injury per athlete-exposure and an annual emergency-department count are not interchangeable. Comparing them directly creates false precision.
Participation is often unknown
For many activities, reliable counts of participants, hours, runs, dives or attempts are unavailable. Large injury totals can therefore reflect popularity as much as individual danger.
Risk changes across eras
Equipment, rescue systems, course design, medical response and regulation change over time. Historical fatality records cannot automatically represent the risk faced by participants today.
One sport can contain several realities
Recreational and elite participation can involve very different exposure. Road cycling, downhill MTB, competitive climbing and expedition climbing should not be collapsed into one generic risk figure.

Why Bull Riding carries a high injury burden
Bull riding exposes athletes to falls, trampling, horn contact and high-energy impact with an animal many times their body mass.
In five years of Canadian professional rodeo surveillance, bull riding produced 32.2 injuries per 1,000 competitor-exposures and the greatest injury frequency of any event studied. A 2024 systematic review likewise found bull riding contributed the highest share of injuries across rodeo events in the included studies, ranging from 19.4% to 58.4%.
Evidence interpretation
U.S. emergency-department volume is not a danger ranking
National Safety Council analysis of U.S. Consumer Product Safety Commission NEISS data estimates that 4.4 million people were treated in emergency departments in 2024 for injuries involving sports and recreational equipment. The NSC explicitly warns that participation frequency and duration are unknown, so these counts should not be used to infer the relative safety of different sports. WU retains the table below as public-health context only—not as the basis for the 40-profile evidence interpretation.
| Sport, activity or equipment | Injuries (*) | Younger than 5 | 5 to 14 | 15 to 24 | 25 to 64 | 65 and older |
| Exercise, exercise equipment | 564,845 | 9,056 | 40,616 | 106,552 | 289,494 | 119,127 |
| Bicycles and accessories | 454,008 | 16,072 | 105,446 | 64,605 | 211,314 | 56,412 |
| Basketball | 385,777 | 1,584 | 128,395 | 176,752 | 76,644 | 2,402 |
| ATV’s, mopeds, minibikes, etc. | 312,924 | 4,197 | 59,126 | 81,427 | 149,753 | 18,393 |
| Football | 318,243 | – | 172,530 | 121,268 | 22,245 | – |
| Skateboards, scooters, hoverboards | 295,067 | 9,095 | 72,815 | 71,023 | 131,317 | 10,736 |
| Soccer | 265,761 | 2,031 | 124,958 | 91,215 | 46,390 | – |
| Playground equipment | 231,245 | 59,501 | 148,211 | 8,429 | 13,118 | 1,985 |
| Swimming, pools, equipment | 182,344 | 19,133 | 71,812 | 30,174 | 47,444 | 13,677 |
| Baseball, softball | 154,757 | 2,947 | 66,587 | 47,221 | 33,721 | 4,280 |
| Trampolines | 118,179 | 26,156 | 71,613 | 11,057 | 9,139 | – |
| Lacrosse, rugby, misc. ball games | 97,511 | – | 25,058 | 30,215 | 25,414 | 16,425 |
| Skating (excl. In-line) | 74,331 | – | 30,368 | 13,638 | 27,661 | 2,140 |
| Fishing | 73,812 | 2,184 | 17,538 | 13,885 | 31,676 | 8,529 |
| Golf | 72,026 | 2,062 | 7,741 | 8,288 | 24,670 | 29,266 |
| Volleyball | 65,440 | – | 20,638 | 30,457 | 13,013 | – |
| Horseback Riding | 48,521 | – | 7,466 | 11,595 | 21,908 | 7,032 |
| Hockey | 46,955 | – | 14,764 | 19,154 | 12,039 | – |
| Martial arts | 34,538 | – | 8,195 | 9,529 | 16,456 | – |
| Track and field activities, equipment | 31,940 | – | 10,486 | 15,079 | 5,542 | – |
| Beach, picnic, camping equipment | 30,738 | 3,641 | 4,686 | 1,432 | 13,543 | 7,437 |
| Racquet sports | 28,251 | – | 3,606 | 5,996 | 10,862 | 7,653 |
| Boxing | 25,863 | – | 2,785 | 12,297 | 10,696 | – |
| Water skiing, tubing, surfing | 17,264 | – | 2,912 | 4,666 | 8,782 | – |
(-): The injury cases are collected from hospital data samples. These injury cases usually have varying stats, explaining the raw numbers in comparative purposes should not be used.
Source: National Safety Council analysis of U.S. Consumer Product Safety Commission NEISS data. National Safety Council. Injury Facts®.
Why danger is more than a number
WU evaluates sports through human exposure, physical environment, historical risk and changes in safety systems.
Human footprint
Training, participation, safety culture and regulation.
Physical footprint
Altitude, water, speed, terrain, animals and weather.
Historical footprint
How risk changed as equipment and standards improved.
Change footprint
New rules, rescue systems, protective gear and medical response.
Sources, limits & corrections
What this guide can—and cannot—prove
This guide separates strong evidence from context, keeps incompatible measures apart and leaves uncertainty visible where sport-specific research is thin.
What WU uses
What WU does not do
See National Safety Council Injury Facts. Individual sport profiles link directly to their principal supporting studies.
Search questions
Questions People Ask About the Most Dangerous Sports
Quick answers to the most common search questions, based on the evidence used throughout this guide.
What is the most dangerous sport?
Short answer: Under the WU evidence framework, BASE jumping has the strongest overall case because we have direct jump-level fatality evidence and an unusually narrow margin for error. That does not mean every dataset produces the same answer: a sport can lead on fatality risk, serious-injury burden or total injury volume depending on the metric used.
What is the most dangerous sport in the world?
Short answer: There is no single scientifically universal answer because sports use different exposure units and injury definitions. In this guide, BASE jumping is the clearest overall high-fatality signal, while cave diving, high-altitude climbing and other sports can look more dangerous under different measures.
What are the top 5 most dangerous sports?
Short answer: WU does not present a false universal top-five ranking. The strongest high-risk profiles in this guide include BASE jumping, cave diving, high-altitude climbing, bull riding and mixed martial arts, but their risks are not directly interchangeable: fatality, trauma, concussion and exposure are measured differently.
What are the top 10 most dangerous sports?
Short answer: There is no defensible universal top-ten list. Use the WU Danger Board and the 40 evidence profiles to compare sports by evidence strength, primary risk and consequence instead of treating one raw number as a universal ranking.
Which sport is most dangerous?
Short answer: If the question is fatality risk per participation unit, BASE jumping has the strongest evidence signal in this guide. If the question is injury frequency, serious trauma or public-health burden, the answer can change because the denominator and population change.
What are the most dangerous sports in the U.S.?
Short answer: U.S. emergency-department data show large injury volumes for activities such as basketball, bicycle riding, football, soccer and swimming, but those counts should not be read as an individual-risk ranking because participation frequency and duration differ. The U.S. table above is therefore used as public-health context, not as proof of which sport is most dangerous.
What are the most dangerous team sports or high-school sports?
Short answer: Risk depends strongly on age, playing level and whether the exposure is training or competition. Rugby, American football, ice hockey, cheerleading, gymnastics and soccer all have meaningful injury evidence in this guide, but WU does not collapse them into one unsupported school-sport ranking.
Is cheerleading, horse riding, soccer or hockey the most dangerous sport?
Short answer: No single one of those sports is supported here as the universal most dangerous sport. Cheerleading has important head-and-neck and stunt-related risks; horse riding can produce severe head, chest and spinal trauma; soccer has a high match-injury burden because participation is enormous; and hockey combines collision injury with concussion risk. Their profiles answer different risk questions.
First-hand submissions enter moderation and do not change a sport’s evidence grade automatically. WU will publish a synthesis only when reviewed journeys show repeated patterns across different participants and contexts.
Public Choice
Reader perception is published separately from the evidence ranking.
Contribute evidence
Participants can submit a documented experience. Submissions enter moderation and never change the ranking automatically.
Submit experienceAdd your journey
Share a relevant first-hand experience for editorial review.
Audience submission · Add your journey
Have you travelled on one of these routes?
Your story enters a private moderation inbox. Automated spam and duplicate checks run first; a WU editor must then verify and approve it before it can appear publicly.
Related evidence cluster
Continue into the activity evidence
- World’s Ultimate Adventures — broader adventure-sports context and routes into the main activity clusters.
- Rock Climbing — technique, participation and climbing context.
- K2: The Savage Mountain — place-led high-altitude context.
- High-Altitude Climbing — preparation and altitude realities.
- Gymnastics and Cheerleading — the Gymnastics & Cheer sub-silo.
- Horseback Riding and Horse Breeds — equestrian activity context.
- Water Sports — rafting, surfing, diving and related water adventure.
- Motocross and Electric Motocross Bikes — off-road motorsport cluster.
This guide was substantially rebuilt in 2026 around evidence quality, exposure and risk type. Some older comments below may refer to the previous numbered ranking or earlier claims that are no longer used in the current guide.

I am a horseback rider and it pains me to see the comments some people put. IN the last 2-3 years three people have lost their lives doing riding and two of the girls were 14! Cheerleading can be hard but most of the time its mistakes that can be prevented. I give props to all gymnasts escpecially thoose training for olympics who give away their lives to after their dream that can bee ruined by one fall. But i will admit horse riding is very dangerous. We spend years perfecting skills and deal with so many injuries and not to mention sore muscles. Plus one wrong move or shifting your postition can kill you and the horse. Everytime we sit in the saddle we risk our lifes but then again riding is ourlife. And people like Sam before you diss us think of people like Jessica Forsyth who was doing the thing she loved most which was jumping with her horse she would ide for and she fell and her horse accidentlycrushed her skull and broke her neck. R.I.P Jessica. So please keep your rude comments to yourself.
you think your muscles get sore?!??!
ella, you dont know what sore is. i wish there was a way to show a video of 1 thing that hapened to me. i was calf roping on a horse that did not know how to work rope well. he reared up in the box falling back and some cowboy ripped my off the horse before it fell on it self and killing 2 kids that where behind me. the horse was killed in the accident the kids where rushed off. after the kids left the horses body was moved they gave me the option to not ride because i dint have a horse, i got on a horse i had never ridden before and roped as soon as i got on i had some much adrenaline pumping that i could not talk even 30 mins after the incident happened. i roped a 3 second run and won the rodeo. i lost my life earnings on the horse my best friend(the horse) and 2 kids died. this is 1 of the many storys i could share so please stop disrespcting not only the sport but the innocent people who have died and the horses who have lost there lifes. you are honestly being kinda selfish for going through these cooments trying to make fun of people that are defending there sport. if you really are just that bad of a person then i feel bad for your parents, friends(probably hasd none),future husband and kids. and notice how we arent saying cheer isnt a sport even tho it isnt. these people where trying to be nice and inform you but u where being a bafoon and scratching your ass while reading.
im sorry but try doing competitive gymnastics for 8 hour a week.
i finished reading that just now, bitch
Hi,
I do cheerleading, gymnastics and horseback riding. But there is another sport that i do that i think is way more dangerous than them all. Horse vaulting this is gymnastic on a moving horse. We do not wear helmets or anything just leotards and when you are doing your cantre freestyle on a 17hh horse you have every right to be scared. But i think the thing that makes it the worst, is team cantre freestyle this is when your vaulting team come up with moves that they can do together were you can have up to 3 people on the cantering horse at one time. And because horses have a mind of there own and are so unpredictable, it can spook, buck or rear anytime. But don’t worry the number one thing we are taught is to be considerate to the horse so we definately do not hurt them 🙂
The author should know that the base jumper’s skills have a great deal to do with his chance for survival. As well, some years ago, a thing called a wingsuit was invented, and continues to be developed. Ironically, as I understand it, Wingsuit flying is even more dangerous than basic base jumping.
I do not pretend to be an authority on the subject yet the author of this article does! I would greatly appreciate an update on this article. Thanks.
dude, american football has way more injuries per year than rugby… read a fucking book bro
Watch the fricking equestrian sports in the Olympics, bro.
MMa is for sure on of the most brutal and dangerous sports out there. Imagine getting elbowed and kneed in the face several times than thrown to the ground and getting punched while on the ground until you can’t see straight and then expected to do it again. And again. And again. So yeah for all you haters out there that’s mixed martial arts. Trust someone who knows what it feels like
I’ve been rode for ten years and one thing I’ve learned is that one way you can prevent injury is by being strong and having muscle. When I go to the barn, these people aren’t exactly jacked; a lot of them have a normal muscle mass and so of course you should expect to be injured if you have a weak frame.
Muscle mass isn’t going to help you if your horse decides to step on your neck.
Many people are complaining that cheerleading is not a dangerous sport, look at the number of injuries in the statistics. Almost 22,861 injuries in people between the age of 15 to 20. I enjoyed reading this article, many sports that I never thought would be dangerous is actually in this list 😐
And then my wife complains and wonders why I never play any sports !!!! This is dangerous 😀
Base jumping should not be even considered as a sport, it is straight suicide! Either you land safely or face death!
Well, I have done gymnastics and cheerleading both. To be honest I find both of them to be equally dangerous as it includes high jumps and bruises are very common. I have got ankle sprains many times… well as you grow you only remember the fun and passion so its worth the pain 🙂