
WORLDSULTIMATE · FOREST & ENVIRONMENT / AI & ENERGY
AI Carbon Emissions: What We Actually Know
A source-led investigation of AI electricity demand, carbon emissions, water, hardware and the limits of per-query estimates.
AI · ENERGY · DATA CENTRES · WU MEDIA RECORD
01 · OVERVIEW
AI's environmental footprint is measurable at some levels—and opaque at others.
AI training and deployment happen mainly in data centres, so the clearest evidence starts with electricity demand, the generation mix supplying that electricity, cooling and water systems, and the hardware and buildings required to run the workload.
The International Energy Agency estimates that global data-centre electricity use reached about 485 TWh in 2025 and projects roughly 950 TWh by 2030 in its central outlook. AI-focused data centres are growing faster than the sector as a whole. That establishes a real and rising infrastructure burden, but it does not mean every additional unit of data-centre demand is caused by AI.
The weakest part of public debate is false precision. A single AI request does not have one universal carbon footprint. The result changes with model, task, output length, accelerator, utilization, data-centre efficiency, cooling system, location, time and electricity mix. Company-wide sustainability reports also do not isolate the full footprint of individual models.
How does AI actually create carbon emissions?
The direct operational pathway is electricity. Accelerators such as GPUs and other specialized chips consume electricity while models are trained and while users run inference. Cooling, networking, storage and power-conversion systems add additional facility demand.
Carbon emissions depend on how that electricity is generated. A workload supplied by a lower-carbon grid can have a very different operational footprint from the same workload supplied by a fossil-heavy grid. Annual renewable-energy matching can improve a company's overall electricity accounting, but it is not the same thing as proving that every AI workload was powered by carbon-free electricity at the exact hour and location it ran.
The footprint also extends beyond operations. Servers, chips, cooling equipment, batteries and buildings have embodied emissions from materials, manufacturing and construction. ITU's 2026 assessment of digital companies found that value-chain emissions dominate the footprint for companies that disclose them, which is an important warning against looking only at electricity at the data-centre meter.
Water is another separate resource issue. Data centres may consume water directly for cooling and indirectly through electricity generation. Berkeley Lab's 2025 review found workload-level water use can vary by more than four orders of magnitude depending on server efficiency, grid water intensity, utilization, cooling, climate and other factors. That makes one global 'litres per prompt' number especially unreliable.
What does the current record actually establish?
The IEA's 2026 update says data-centre electricity consumption grew 17% in 2025, while electricity use from AI-focused data centres grew faster. Its central outlook still sees global data-centre electricity use roughly doubling from 2025 to 2030, with AI-focused facilities tripling their electricity use over that period.
The same IEA analysis also complicates the popular idea that each AI request is inevitably getting more energy-hungry. Energy use per individual AI task has been falling rapidly because hardware and software are becoming more efficient. The problem is scale and workload mix: more people are using AI, models are being used more often, and reasoning, agents and video generation can require far more computation than a simple text exchange.
In the United States, Berkeley Lab's 2025 update estimates data centres could account for about 11.8% of national electricity use by 2030 in its reference case, with a scenario range from 9.5% to 15.3%. The authors attribute growth primarily to the deployment and increasing rated power of accelerated servers. That is a national infrastructure projection, not a measurement of AI emissions alone.
The corporate picture is mixed rather than one-directional. Google reports continued clean-energy procurement and efficiency improvements, including a large improvement in TPU power efficiency, while Microsoft reports extensive clean-energy procurement, lower-water cooling designs and embodied-carbon reductions in new construction. Those initiatives matter, but they coexist with rapid infrastructure expansion.
Industry-wide reporting remains incomplete. ITU and the World Benchmarking Alliance reported in 2026 that digital-company operational emissions rose in 2024 while Scope 3 emissions dominated the footprint among companies that disclosed them. Stanford's Foundation Model Transparency Index has separately found major gaps in model-level disclosure of energy, carbon and water information.
That means the strongest conclusion is not that 'AI has one known footprint'. It is that AI is an increasingly important driver of data-centre growth, while model-level environmental accounting remains too incomplete for many precise public claims.
What changes the footprint from one AI workload to another?
The first variable is the task. A short text completion, long-context reasoning run, image generation, video generation and an autonomous agent are not equivalent workloads. Output length and repeated tool use can change compute substantially.
The second is the hardware and how well it is used. New accelerators can perform more computation per unit of electricity, but low utilization wastes capacity. Efficiency improvements therefore reduce energy per unit of work without guaranteeing lower total energy use.
The third is the data centre. Power-usage effectiveness, cooling technology, climate, networking, storage and idle infrastructure all change how much facility electricity is required beyond the processors themselves.
The fourth is location and timing. Electricity carbon intensity varies between regions and across hours. Water stress, cooling options and the water intensity of electricity generation also vary geographically.
Finally, scale can overwhelm efficiency. If energy per task falls but total AI use, model size and high-compute use cases grow faster, absolute electricity demand can still rise. This is the rebound problem at the centre of the AI-energy debate.
What must be counted before calling something an AI footprint?
A credible environmental claim should make clear which layer is being measured and which layers are outside the boundary.
Training and inference
Both consume electricity, but their relative importance depends on model lifecycle and usage.
- Do not assume training always dominates.
- Do not assume inference always dominates.
- State model, workload, output and time period where possible.
- Separate a one-time training run from repeated deployment.
Grid carbon intensity
Electricity use is not the same thing as carbon emissions.
- Report energy and emissions separately.
- Identify location or grid mix where possible.
- Distinguish annual renewable matching from time-matched carbon-free supply.
- Avoid converting energy into CO₂ without a stated emissions factor.
Cooling and overhead
Processors are only part of facility demand.
- Include cooling and power-conversion overhead where the boundary allows.
- State whether figures are chip-level, server-level or facility-level.
- Account for utilization and idle capacity.
- Do not treat PUE as a universal constant.
Direct and indirect water use
Water use depends heavily on site and system design.
- Separate on-site cooling water from water used in electricity generation.
- Consider local water stress, not only total litres.
- Avoid universal water-per-prompt figures.
- State whether water withdrawal or consumption is being reported.
Embodied emissions
AI infrastructure has a supply-chain footprint before it is switched on.
- Chips, servers, batteries and buildings require materials and manufacturing.
- Construction emissions matter as data-centre capacity expands.
- Scope 3 can dominate total corporate footprints.
- Operational efficiency alone does not capture lifecycle impact.
What companies actually reveal
Corporate sustainability data are usually broader than model-level AI data.
- Company totals include much more than one AI model.
- Model-level energy and water disclosure remains inconsistent.
- Third-party assurance improves confidence but may cover only selected metrics.
- Treat undisclosed inputs as uncertainty, not as zero.
Efficiency versus total demand
Better chips can reduce energy per task while total power demand still rises.
- Track both intensity and absolute consumption.
- More users and more capable workloads can offset efficiency gains.
- Reasoning, agents and video can be much more compute-intensive than simple text.
- Forecasts should be treated as scenarios, not certainties.
AI can also reduce emissions elsewhere
Environmental accounting should consider enabled reductions—but not use them to erase the footprint automatically.
- AI can support grid, transport and industrial optimization.
- Enabled reductions require their own evidence and counterfactuals.
- Corporate 'avoided emissions' estimates are not the same as operational emissions.
- Benefits and burdens should be reported separately.
How to test an AI-environment claim
These checks help distinguish a defensible estimate from a headline number that hides its assumptions.
'One prompt emits X grams of CO₂'
- Which model and version?
- What task and output length?
- Which hardware and utilization?
- Which data centre, location and grid?
Without those inputs, a prompt-level carbon number is not universal and should be treated as a scenario, not a fact.
'AI uses more energy than search'
- Which AI workload?
- What search baseline?
- Text, reasoning, image or video?
- Same year and hardware generation?
Simple text AI has become much more efficient, while reasoning, agents and media generation can be vastly more compute-intensive.
'Renewables make the AI carbon-free'
- Annual matching or hourly supply?
- Physical grid or contractual procurement?
- Same region as the workload?
- Operational or lifecycle emissions?
Renewable procurement can lower reported electricity emissions without proving that every workload ran on carbon-free power at that hour and location.
'AI uses X litres of water per query'
- Direct cooling only?
- Electricity-generation water included?
- Which climate and cooling system?
- Which server efficiency and utilization?
Workload water use can vary enormously across infrastructure and geography, so one global per-query figure is usually misleading.
'Company emissions rose because of AI'
- What did the company actually attribute?
- Scope 1, 2 or 3?
- Construction and hardware included?
- Cloud and non-AI growth separated?
AI may be an important driver, but company-wide emissions also include construction, supply chains, offices, hardware and other services.
'Efficiency will solve the problem'
- Is intensity falling?
- Is total electricity use also falling?
- Are workloads becoming more complex?
- Is usage growing faster than efficiency?
Energy per task can decline while absolute electricity demand rises because total use, model capability and infrastructure scale grow faster.
What the record supports—and where it stops.
A concise conclusion, the evidence supporting it, and the uncertainty that remains.
AI is a significant and growing driver of data-centre electricity demand, but its carbon footprint cannot be represented responsibly by one universal per-query number.
IEA and Berkeley Lab document rapid data-centre electricity growth linked in large part to accelerated computing; ITU/WBA document rising digital-sector energy and emissions; Berkeley Lab shows extreme variability in workload water use; company and Stanford transparency evidence shows model-level disclosure remains incomplete.
Data-centre statistics include non-AI workloads, corporate sustainability reports include activities beyond AI, and model providers rarely disclose enough workload-level information for independently verified carbon or water footprints. Forecasts are scenarios rather than guaranteed outcomes.
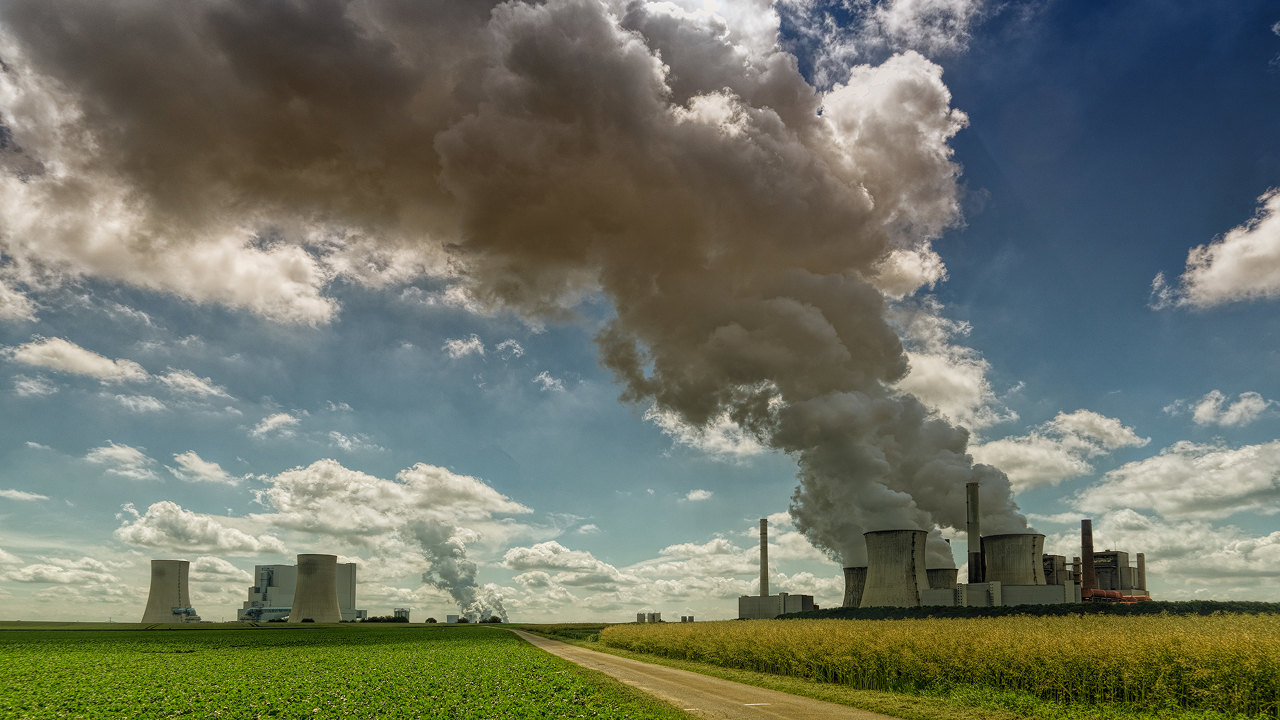 IN CONTEXT
The footprint sits behind the interface.
The visible AI response is only the end of a physical chain: chips, servers, electricity, cooling, networks, buildings and supply chains. The environmental result depends on how that system is designed, powered, located and used.
A photograph can document visible conditions. It cannot establish cause, trend or risk without supporting records.

Training and inference both matter
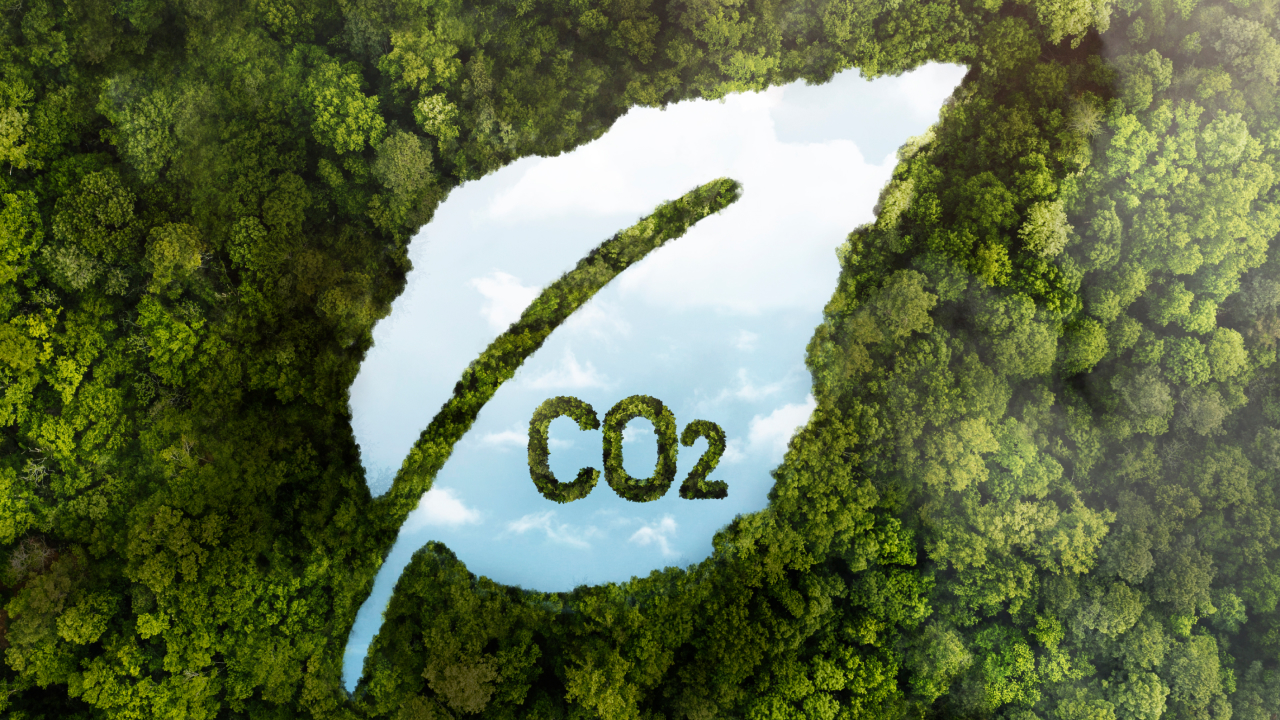
Electricity source changes the result
Hardware and buildings sit outside the screen
EVIDENCE AND CONTEXT
What the record supports. And where it stops.
The evidence supports concern, but not simplistic certainty. AI is contributing to a genuine increase in data-centre electricity demand, and that growth matters for grids, emissions, water systems and supply chains. The strongest 2026 evidence also shows that efficiency is improving quickly, so older per-query comparisons can become obsolete surprisingly fast.
Author and Reader Experience Editor at WorldsUltimate. Zaib Un Nisa Khalid is a clinical psychology postgraduate, writer and editor. She reviews reader clarity, language, human context and the responsible treatment of personal experiences while contributing across travel, lifestyle and human-behaviour topics.
The sources and context help explain what is known, what remains uncertain and where to read further.
Understanding the details.
Zaib un Nisa Khalid's role on this page is editorial rather than technical authority. Her contribution is to clarity, responsible framing and distinguishing what the sources establish from what they do not. The technical conclusions come from energy-system analysis, data-centre research, corporate disclosures and transparency studies.
The most important distinction is between intensity and scale. A new accelerator can use less energy for the same amount of computation, while total electricity demand still rises because far more computation is being purchased. Both statements can be true at the same time.
A second distinction is between data-centre electricity and AI carbon emissions. Electricity demand can be measured or modelled at facility and sector level. Converting that into AI-specific carbon requires knowing which workloads were AI, where and when they ran, what electricity supplied them, and what lifecycle boundary is being used.
A third distinction is between disclosure and measurement. Google, Microsoft and other companies publish increasingly detailed sustainability information, but company-wide environmental reports are not a substitute for independently verifiable model-level footprints. Stanford's transparency work shows that this remains a major information gap.
The practical conclusion is therefore a measurement hierarchy: start with what is directly observed, separate energy from emissions, identify the system boundary, state uncertainty, and avoid universal prompt-level numbers unless the underlying workload and infrastructure are actually known.
Keep the investigation correctable.
IEA · Key Questions on Energy and AI (2026) ↗
Latest IEA analysis of data-centre electricity demand, AI-focused growth, rapid efficiency gains and increasingly compute-intensive AI use cases.
IEA · Energy and AI (2025) ↗
Global framework for data-centre electricity demand, AI infrastructure, energy supply and climate implications.
Berkeley Lab · U.S. Data Center Energy Usage Report: 2025 Update ↗
Bottom-up U.S. data-centre electricity scenarios through 2030 and analysis of accelerated-server growth.
Berkeley Lab · Water use of data center workloads (2025) ↗
Peer-reviewed assessment showing workload water use varies by more than 10,000-fold depending on infrastructure, grid, cooling, climate and efficiency.
ITU/WBA · Greening Digital Companies 2026 ↗
Current industry-wide assessment of digital-company operational emissions, electricity use, Scope 3 reporting and climate targets.
Google · 2026 Environmental Report ↗
Company disclosure on clean-energy procurement, efficiency, water replenishment and enabled emissions reductions; useful as corporate evidence, not a model-level footprint.
Microsoft · 2026 Environmental Sustainability Report ↗
Company disclosure covering data-centre design, clean electricity, water, materials and carbon-removal strategy.
Stanford · Foundation Model Transparency Index 2025 ↗
Independent assessment showing major gaps in environmental and compute transparency among foundation-model developers.
READER SIGNAL
Did this investigation answer the question?
ADD YOUR EVIDENCE
Your record can add missing context.
Include the place, date, what happened and a source editors can inspect. Submissions are moderated and do not automatically change the conclusion.
Audience submission · Add your evidence
Submit documented evidence
Your evidence enters a private moderation inbox. Automated spam and duplicate checks run first; a WU editor must then verify and approve it before it can appear publicly.